
FIGURE 3.
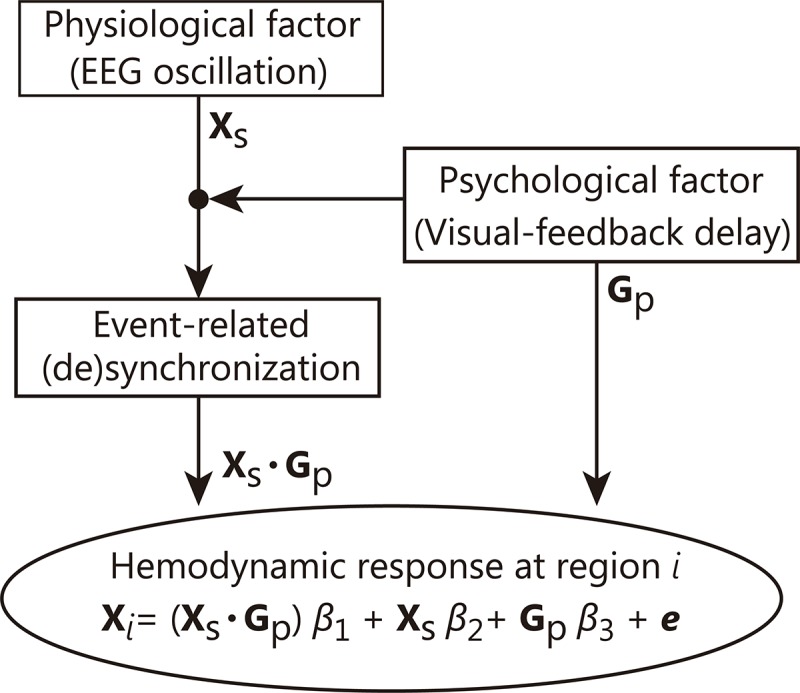
Schematic chart of our ERS/D-based PPI analysis. In this technique, the hemodynamic response (explained variable Xi) in a region i is estimated as a superposition of impulse responses. The regression coefficient is calculated so that the error (e) between the estimated hemodynamic response (Xi) and the observed hemodynamic response is minimized. This analysis can be interpreted as estimating the area where the contribution from a certain ERS/D is increased by an event (psychological or experimental factor).