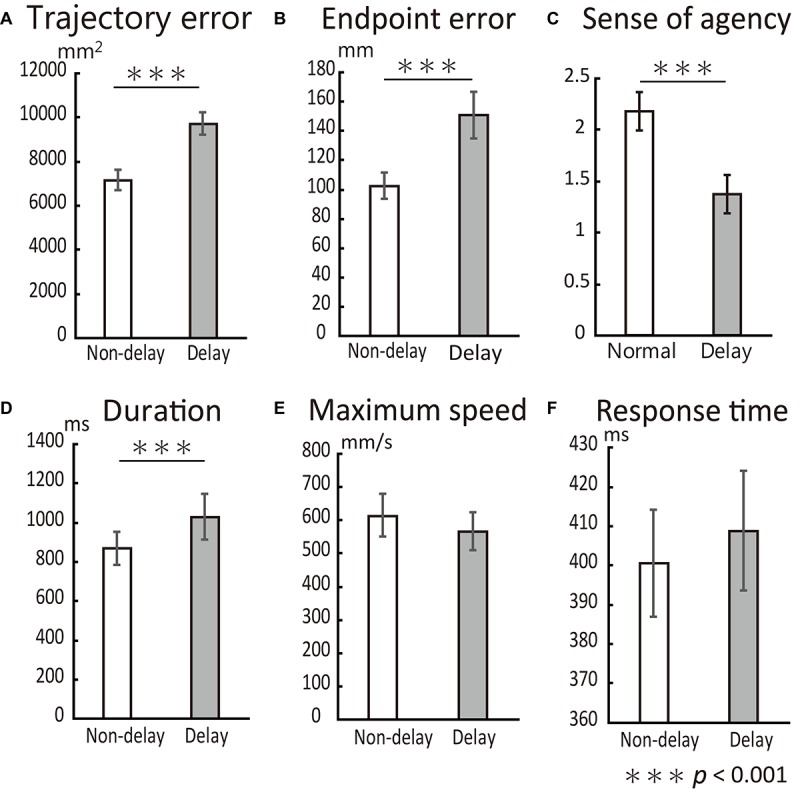
FIGURE 4.

Behavioral results. All error bars represent the mean SE. (A) Trajectory error was significantly increased by the delay in visual feedback. (B) Endpoint error was also significantly increased by the delay. (C) SoA score dropped with the delay. (D) The duration of reaching movements was significantly larger in the Delay condition than in the Non-delay condition but did not affect task performance. Neither maximum reaching speed (E) nor response time (F) differed between conditions.
