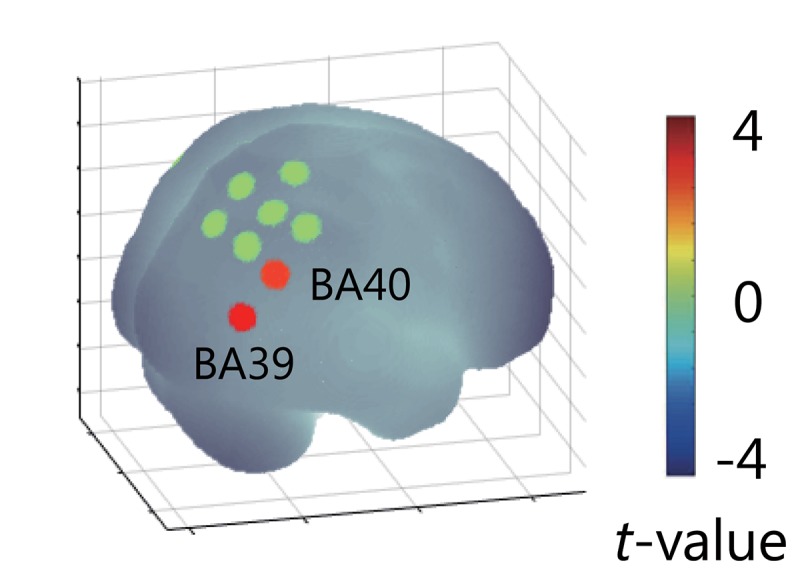
FIGURE 8.

Results of ERS/D-based PPI analysis. The result showed activation of right angular and supramarginal gyri, which was explained by the γ-ERS that occurred when visual feedback was delayed (p < 0.05). This delay-specific activity in the right IPL could not explained by α-ERD.
