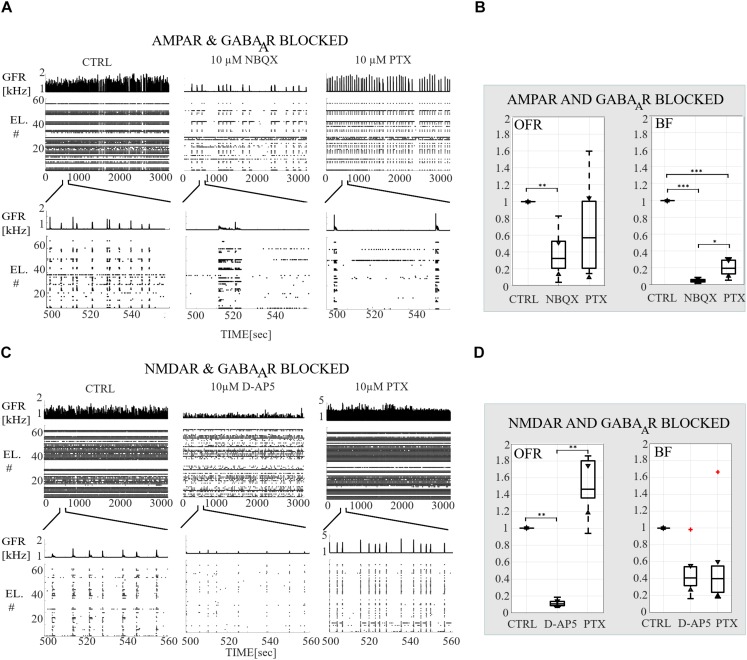
FIGURE 2.
Receptor-dependent network-wide activity probed by acute application of AMPA, NMDA and GABAA receptor antagonists, relative changes in OFR and in BF. (A) Raster plots of network-wide activity. In each subpanel, the global firing rates (GFR [kHz]) are displayed on top of raster plots of spike times (TIME [s]) from each electrode (EL #) in each condition. The first subpanel shows the CTRL recording, the second subpanel the activity after acute application of AMPAR antagonist (10 μM NBQX), and the third subpanel the activity after acute applications of both antagonists of AMPAR and GABAAR (10 μM PTX). The top row shows the complete analyzed recording of 3,000 s, and the bottom row enlargements of 60 s to display fine details of the activity. (B) Relative change in OFR and in BF are computed for each recording and then displayed as box plot representation of pooled rates of the CTRL recordings (n = 7), of the recordings when AMPARs are antagonized (NBQX, n = 7) and of the recordings when both AMPARs and GABAARs (PTX, n = 7) are antagonized. (C) Same as (A) except that the CTRL recording is compared to the recording when NMDARs (10 μM D-AP5) and both NMDARs with GABAARs (10 μM PTX) are acutely antagonized. (D) Same as (B) except that the CTRL recordings (n = 6) are compared to conditions when NMDARs are antagonized (D-AP5, n = 6) and to the conditions when both NMDARs and GABAARs (PTX, n = 6) are antagonized. Both AMPAR and NMDAR antagonists significantly decreased the OFR (pranksum < 0.01) (B,D). Disinhibition significantly increased the OFR in NMDAR blocked cultures (pranksum < 0.01), but not in AMPAR blocked cultures compared to the condition before disinhibition (B,D). AMPAR blockade significantly decreased the network BF (pranksum < 0.001) and followed disinhibition slightly increased BF (pranksum < 0.05) compared to the condition before disinhibition. The box plots show the median, 25th and 75th percentiles and whiskers extending to the minimal and maximal values and the plus signs represent outliers. ∗∗∗pranksum < 0.001, ∗∗pranksum < 0.01, ∗pranksum < 0.05.

