FIGURE 3.
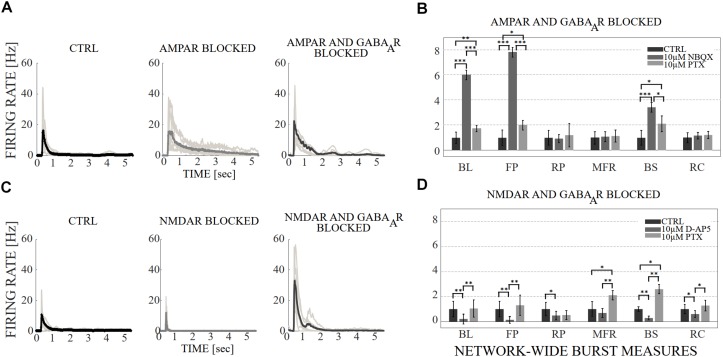
The influence of acute application of the excitatory and inhibitory receptor antagonists on NB profiles and measures. (A) The top row shows the NB profiles [Hz] from six congruent experiments where the data of the CTRL recording (1st subpanel) is compared to the data of the recording conditions when AMPARs (2nd subpanel), and AMPARs with GABAARs (3rd subpanel) are antagonized. The thin gray lines represent the average NB profiles of each culture, whereas the thick line represents the average over all cultures. The profiles are aligned with each other at the time point when the rate is reached. The presented profiles are computed using the spike-data from Figure 2, processed as described in section “Materials and Methods”. (B) The relative change of characteristic burst measures including, BL, FP, RP, MFR, BS and RC are extracted from NB profiles (see section “Materials and Methods”). Each bar represents the mean ± SD of the medians from all cultures. The values were normalized to the CTRL condition. The panel shows the relative change in AMPAR (10 μM NBQX) blocked networks, followed by GABAAR (10 μM PTX) blockade (n = 7). (C) Shows the same as (A), except the data of the CTRL recording (1st subpanel) is compared to the data of the recording conditions when NMDARs (2nd subpanel) and NMDARs with GABAARs (3rd subpanel) are antagonized. (D) Shows the same as (B), except that the relative change is computed in NMDAR blocked networks (10 μM D-AP5), followed by GABAAR (10 μM PTX) blockade (n = 6). BL, FP and BS increased significantly (pranksum < 0.001) when applying acute AMPAR blockade compared to CTRL (B). BL (pranksum < 0.001), FP (pranksum < 0.001) and BS (pranksum < 0.05) decreased significantly when acutely disinhibited, and compared to previous AMPAR blocked condition (B). In contrast, BL (pranksum < 0.01), FP (pranksum < 0.01), RP (pranksum < 0.05), BS (pranksum < 0.01) and RC (pranksum < 0.05) significantly decreased when NMDARs were blocked (D). Furthermore, BL (pranksum < 0.01), FP (pranksum < 0.01), MFR (pranksum < 0.01), BS (pranksum < 0.01) and RC (pranksum < 0.05) significantly increased when disinhibited and compared to the previous NMDAR blocked condition (D). ∗∗∗pranksum < 0.001, ∗∗pranksum < 0.01, ∗pranksum < 0.05.

