FIGURE 6.
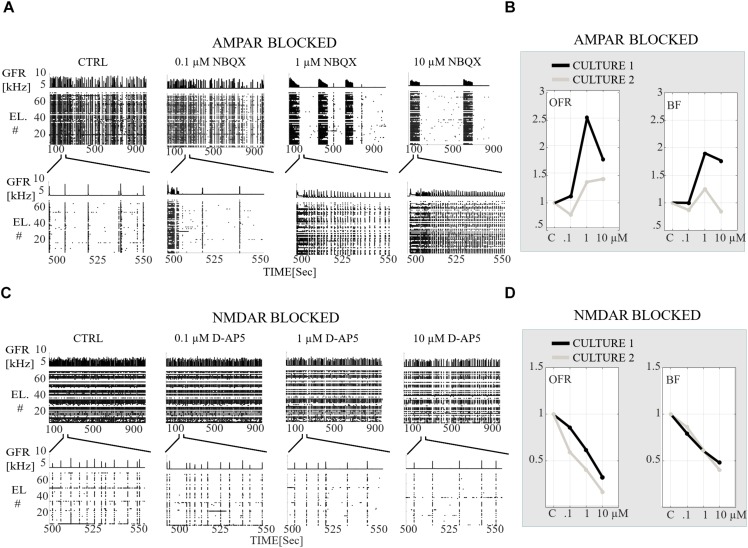
Receptor-dependent network-wide activity probed by gradual application of AMPA and NMDA receptor antagonists, relative changes in OFR [Hz] and in BF [NB/min]. (A) Raster plots of network activity of the CTRL recording probed by gradual application of AMPAR antagonist (0.1, 1, and 10 μM NBQX). In each subpanel, the global firing rates (GFR [kHz]) are displayed on top of the raster plots of spike times [s] from electrodes (EL #) in each condition. Top row shows the completely analyzed recording of 900 s, and the bottom row enlargements of the 60 s to display fine details of the activity. (B) Relative change in OFR and BF with respect to those obtained from the CTRL condition as shown for each recording (n = 2 cultures). This relative change is computed as described in the section “Materials and Methods”. The values of the applied NBQX concentrations are shown on the x-axis. (C) Same as (A) except that a CTRL recording is probed by gradual application of NMDARs antagonists (0.1, 1, and 10 μM D-AP5). (D) Same as (B) except that the CTRL recordings are compared to condition when NMDARs are gradually antagonized with 0.1, 1, and 10 μM D-AP5. Gradual AMPAR blockade increased the OFR in both cultures in comparison to the CTRL condition (B). Gradual application of NMDAR antagonist gradually decreased the OFR and BF in comparison to the CTRL condition (D).

