FIGURE 5.
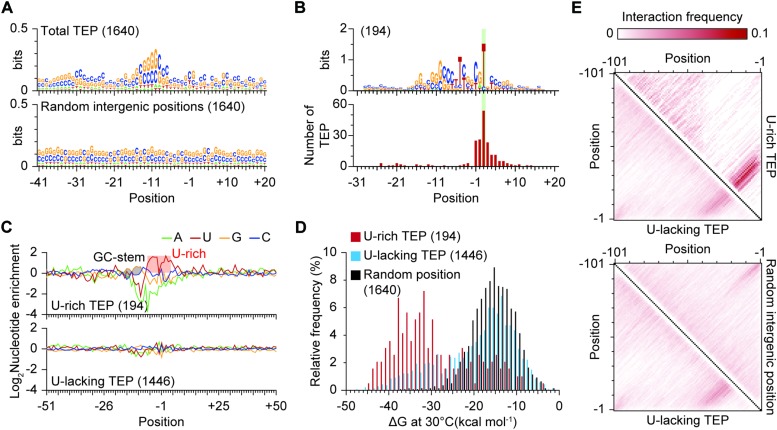
Identification of a U-rich motif near transcript 3′-end positions (TEPs). (A) Sequence alignment near TEPs or randomly selected intergenic positions. The 41 nt upstream to 20nt downstream sequences of TEPs were used for sequence logo generation using Weblogo. (B) The conserved U-rich motif. (C) Nucleotide enrichment analysis of the two types of TEPs. Nucleotide enrichment was calculated by dividing the frequency of each nucleotide for the TEP sets with the frequency of the same nucleotide of randomly selected intergenic positions. (D) ΔG distribution of TEPs. The ΔG was calculated from upstream 41 nt sequences, including TEPs or randomly selected intergenic positions using RNA fold with the temperature parameter of 30°C. (E) Structure comparison between U-lacking TEPs, U-rich TEPs and randomly selected intergenic positions.

