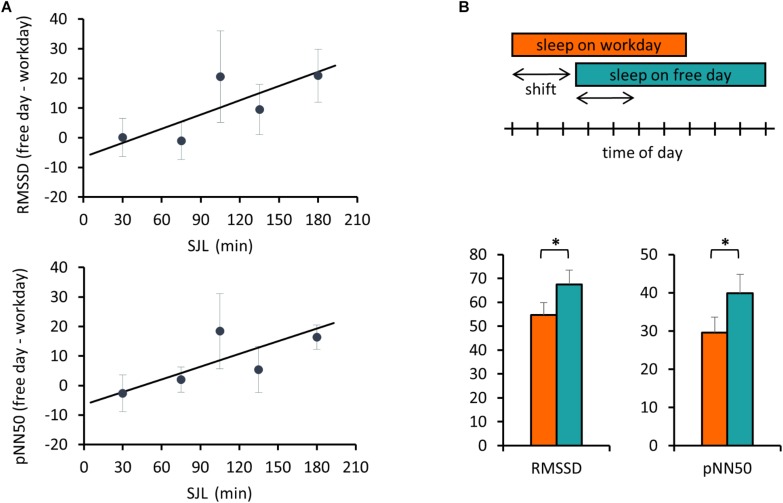
FIGURE 2.
Free day – workday differences in HRV during sleep are associated with SJL. (A) Correlation of SJL with the difference between free and workday values of RMSSD and pNN50. RMSSD and pNN50 values were averaged for the first 2 h of sleep. Individual free day – workday differences in RMSSD (upper panel) and pNN50 (lower panel) were calculated and correlated with SJL. For better visualization mean values for SJL intervals of either 30 or – in case of low sample number (first and last two intervals) – 60 min are shown. Trend lines for linear regression are shown (upper panel) Pearson’s r = 0.365, p = 0.047, n = 30 and (lower panel) Pearson’s r = 0.4135, p = 0.023, n = 30. (B) Advanced sleep timing on workday is related to a lower HRV. Schematic illustration of the analyzed sleep periods (indicated by the arrows) equal to the shift of sleep onset between work and free day. The boxes represent the time of day from sleep onset until waking (upper panel). RMSSD and pNN50 data were averaged for the shift periods and compared between work and free days (lower panel). Paired t-test, ∗p < 0.05, n = 18.

