

Summary
Activation of B and T lymphocytes leads to major remodelling of the metabolic landscape of the cells enabling their post‐activation functions. However, naive B and T lymphocytes also show metabolic differences, and the genesis, nature and functional significance of these differences are not yet well understood. Here we show that resting B‐cells appeared to have lower energy demands than resting T‐cells as they consumed lower levels of glucose and fatty acids and produced less ATP. Resting B‐cells are more dependent on OXPHOS, while T‐cells show more dependence on aerobic glycolysis. However, despite an apparently higher energy demand, T lineage cells showed lower rates of protein synthesis than equivalent B lineage stages. These metabolic differences between the two lineages were established early during lineage differentiation, and were functionally significant. Higher levels of protein synthesis in B‐cells were associated with increased synthesis of MHC class II molecules and other proteins associated with antigen internalization, transport and presentation. The combination of higher energy demand and lower protein synthesis in T‐cells was consistent with their higher ATP‐dependent motility. Our data provide an integrated perspective of the metabolic differences and their functional implications between the B and T lymphocyte lineages.
Keywords: B‐cells, metabolic differences, ribo‐seq, RNA‐seq, T‐cells
Introduction
B and T lymphocytes arise from a common lymphoid progenitor (CLP) cell population, and a single CLP cell can differentiate into both B‐ and T‐cells.1 B or T lineage commitment involves rearrangement of the B‐cell receptor (BCR) or T‐cell receptor (TCR) loci, with three broad stages of the differentiation programme.2, 3, 4 An early stage is characterized by recombination at the BCR‐heavy chain or TCR‐beta‐chain loci, the pro‐B and the CD4− CD8− (double‐negative‐T; DN‐T) stages. This transitions through multiple rounds of proliferation to pre‐B or CD4+ CD8+ (double‐positive‐T; DP‐T) stages during which light chain loci undergo recombination. The resultant immature‐B or CD4/CD8‐single‐positive‐T (SP‐T) cells carry full‐fledged BCRs and TCRs, and mature further into functional naive B‐ and T‐cells that migrate to peripheral lymphoid organs. Throughout these analogous transitions, both lineages share microenvironmental cues, signalling pathways and somatic DNA recombination machinery.5, 6, 7, 8 Developing B‐ and T‐cells share approximately 90% of constitutively expressed genes, highlighting the similarities between these two cell types.9
Upon activation, mature B‐ and T‐cells undergo upregulation of protein synthesis and a burst of cell proliferation. Translational upregulation of the cap‐binding factor eIF4E is required for the proliferation of CD4 T‐cells upon activation,10 and mRNA‐binding protein and complexes are involved as well.11 Once activation‐induced proliferation and effector differentiation is completed, effector T‐cells show overall protein synthesis levels similar to naïve T‐cells.12 However, unlike T‐cells, plasma cells maintain high levels of protein synthesis, generating and secreting antibodies at rates of > 10 000 molecules per second.13, 14 Protein synthesis thus represents a major distinction between the effector stages of B‐ and T‐cell lineages.
These major transitions during lineage differentiation and immune activation likely require major cellular energy resources. In fact, defects in immune cell metabolism have been shown to be associated with autoimmune diseases.15 In another interesting example, the Harlequin (Hq) strain of mutant mice, which are hypomorphic at the gene for the apoptosis‐inducing factor (AIF), a constitutively expressed mitochondrial protein and a component of oxidative phosphorylation, show a specific T‐ but not B‐cell lineage differentiation defect.16, 17 The balance of glucose utilization between complete oxidative phosphorylation (OXPHOS) or partial utilization via aerobic glycolysis can be modulated by the extracellular milieu of the cells as well as the cell‐type‐specific changes in gene expression. These metabolic choices can have functional consequences. The hypoxic niche of long‐term haematopoietic stem cells is consistent with their reliance on glycolysis rather than OXPHOS for energy requirements.18 Peripheral trafficking and survival of resting T‐cells require mitochondrial maintenance via sphingosine‐1‐phosphate signalling, indicating a crucial role for mitochondrial OXPHOS.19 Activation of both mature B and T lymphocytes leads to the remodelling of their metabolism,20 the most striking feature being the upregulation of glycolytic ATP production in both B‐ and T‐cells despite oxygen‐replete conditions.21, 22
On this background, it would be expected that B‐ and T‐cell lineages would show similar metabolic landscapes during most of their lives, with differences arising only at late effector stages. However, there are indications that this may not be so. Distinct stages of T‐cell activation depend on aerobic glycolysis and OXPHOS so that initial proliferation requires OXPHOS while cytokine secretion depends on aerobic glycolysis.23 On the contrary, there is little dependence of B‐cells on glucose post‐activation despite increased glucose uptake, while perturbation of OXPHOS results in poor differentiation.17, 24 However, the comparative metabolic landscape of B and T lineages is not yet well understood.
In this context, we show data comparing basal energy metabolism and protein synthesis in B‐ and T‐cell lineages. We find that resting T‐cells showed higher levels of glucose uptake as well as ATP levels compared with resting B‐cells. Resting B‐cells showed increased sensitivity to inhibition of mitochondrial OXPHOS and showed higher levels of mitochondrial mass. Moreover, we also observe that resting B‐cells showed increased protein synthesis compared with resting T‐cells. The two lineages showed this metabolic divergence at early stages. The translatome of B‐cells revealed increased translation of genes associated with antigen internalization and presentation, suggesting that B‐cells may be poised for post‐activation functions. On the other hand, the increased ATP content of T‐cells correlated with their higher motility. Finally, perturbation of one constitutively expressed metabolic gene such as AIF results in modification of key metabolic processes such as glucose uptake and protein synthesis in a T‐cell lineage‐specific fashion. Our data provide an entry point for understanding the genesis, nature and functional significance of metabolic differences between the closely related yet functionally distinct B‐ and T‐cell lineages.
Materials and methods
Mice
Various strains of mice as indicated; C57BL/6 (B6), CBA/CaJ and Hq on a mixed C57BL/6 and CBA/CaJ background; were obtained from the Jackson Laboratory (Bar Harbor, ME) and maintained in the animal facility of the National Institute of Immunology. All mice used in the experiments were 6–8 weeks old. All mice were maintained and used, and the study was carried out in accordance with the guidelines and recommendations of the Institutional Animal Ethics Committee. The Institutional Animal Ethics Committee approved the protocol.
Surface staining and intracellular staining for flow cytometry
For surface staining, 0·3 × 106 to 2 × 10⁶ cells were incubated with 50 μl of primary staining reagent appropriately diluted in staining buffer [phosphate‐buffered saline (PBS) containing 0·5% bovine serum albumin (BSA) and 0·1% sodium azide], on ice for 30 min in 96‐well round‐bottom polystyrene plates (Tarsons, Kolkata, India). The cells were washed twice with cold staining buffer, followed by incubation for 30 min with 50 μl of appropriate secondary reagent diluted in staining buffer at a working concentration. Finally, cells were washed twice with ice‐cold staining buffer and resuspended in PBS to be analysed on a flow cytometer (BD FACSVerse or BD FACSAria II; Becton and Dickinson, San Jose, CA). PBS containing 4% paraformaldehyde (PFA) and 0·2% Triton X‐100 was used for fixation and permeabilization of cells for intracellular staining. Blocking was done with 1% goat serum prior to use of goat anti‐mouse antibodies. Cell‐surface staining was performed with IgM‐peridinin‐chlorophyll (PerCP)‐eFluor710 (clone II/41), B220‐phycoerythrin (PE)‐Cy7 (clone RA3–6B2), anti‐mouse CD43‐APC (clone S7), IgD‐APC (clone 11‐26), CD90‐APC (clone 53‐2·1), CD44‐PerCP‐eFluor710 (clone IM7) (BD Biosciences, eBiosciences). Data were acquired on a flow cytometer (FACSAria II; Becton and Dickinson) and analysed by flowjo software (Treestar, Ashland, OR, USA).
Glucose uptake estimation
Cells were cultured in glucose‐free RPMI1640 containing 2‐NBDG (Cayman Chemicals, Ann Arbor, MI, USA ‐ 186689‐07‐6) at a concentration of 100 μm for 30 min at 37°. The reaction was stopped by adding ice‐cold PBS, and was followed by two washes with cold PBS. Cells were then stained for cell‐surface markers and analysed flow cytometrically as above.
Tritiated leucine incorporation assay
Titrating numbers of magnetically sorted (Miltenyi Biotec, Bergisch Gladbach, Germany) B220+ or CD90+ cells were cultured in a 96‐well plate containing 3H‐leucine at 0·75 μCi/well in leucine‐free medium for 12 hr. Total culture volume was 100 μl. The plate was frozen and later harvested onto glass‐fibre filters for scintillation spectroscopy (Microbeta1450; Perkin‐Elmer, Waltham, MA, USA).
l‐Homopropargylglycine (HPG) incorporation assay
Ex vivo splenocytes, thymocytes and bone‐marrow cells were incubated at a density of 4 × 10⁶ cells/ml in methionine‐free media for 45 min at 37° followed by addition of 25 nm HPG (Life Technologies, Carlsbad, CA, USA ‐ C10186) and incubated at 37° for the next 2 hr. Post‐incubation, cells were washed with 1 × PBS and fixed with 4% PFA (Loba Chemie, Mumbai, India) at room temperature for 15 min, followed by washing with 3 ml PBS containing 1% BSA (Sigma). Next, permeabilization was done with 0·2% Triton X‐100 (Sigma‐Aldrich, St. Louis, MO, USA) containing PBS for 30 min at room temperature and then washed with 3 ml PBS containing 1% BSA. It was followed by incubation with freshly prepared Click‐It reaction mixture for 30 min at room temperature, in the dark. Cells were again washed with 3 ml PBS containing 1% BSA and stained for cell‐surface markers as previously described. The Click‐It reaction components include TRIS (100 mm), l‐ascorbic acid (20 mm; BioBasic, Markham, ON, Canada), CuSO4 (1 mm) (Qualigens, Mumbai, India) and Alexa‐Fluor488 azide (20 μm; Molecular Probes, Invitrogen).
Fatty acid uptake assay
Two million ex vivo splenocytes, thymocytes and bone‐marrow cells were incubated with BODIPY (Life Technologies) at 37° for 3–4 min followed by staining with cell‐surface markers.
Motility assay
Bone‐marrow‐derived dendritic cells (BMDCs) were cultured, as previously described.25 Sorted B220+ and CD90+ cells were CFSE labelled and cultured on BMDC monolayers. Cells were rested in the incubator for 2 hr, and then images were taken on Nikon Zeiss microscope every 5 min for 2 hr. Data were analysed in Imaris (Bitplane) where average track length was calculated from multiple time‐lapse movies for 35–40 cells.
Mitochondrial mass detection
Ex vivo spleen, thymus and bone‐marrow cells were cultured at a density of 5 × 10⁶ cells in incomplete RPMI with 25 μm Mitotracker Green (MG; Molecular Probes, Invitrogen, Eugene, OR) in the dark at 37° for 30 min. Cells were washed twice with cold PBS followed by cell‐surface staining. Analysis was done on BD FACS Verse or BD FACS ARIA (Becton and Dickinson).
Seahorse XFe24 analyser experiment
Seahorse XF e 24 analyser experiment was performed as previously described.26 Cells were sorted from spleen, thymus and bone‐marrow cells and rested for 1 hr in RPMI supplemented with 10% fetal bovine serum at 37°. The cells were washed twice in pre‐warmed XF base medium supplemented with 5·5 mm d‐glucose, 4 mm l‐glutamine and 1 mm pyruvate (assay medium). XF e 24‐well plates were coated for 20 min at room temperature with freshly prepared 22·4 μg/ml Cell tak (Corning, Corning, NY, USA) in sodium bicarbonate solution. After aspirating the Cell‐tak solution, the plate was washed twice with sterile water; 0·3 million cells in 100 μl volume were plated in triplicate and rested for 30 min in a non‐CO2 incubator. Each well was gently topped with 500 μl assay medium and rested for another 30 min before being loaded onto the seahorse XF e 24 extracellular flux analyser (Agilent Technologies, Santa Clara, CA). Three readings for oxygen consumption rate (OCR) and extracellular acidification rate (ECAR) were taken with a 15 min break in between. The mean of three readings was used for plotting data for each well. Data have been represented as mean ± SE for triplicate wells of each sample.
Lactate assay
Total B‐ and T‐cells were sorted from the spleen of a C57BL/6 mouse and cultured in phenol red‐free RPMI for 4 hr. Culture supernatant was harvested and stored at −80° until further processing. Biovision lactate colorimetric kit was used for quantification of lactate. Samples were diluted 1 : 1 in assay buffer and incubated with reaction mix for 30 min. Lactate in the sample reacts to generate a product that reacts with the probe to give a coloured product read out at 570 nm using an ELISA plate reader (Tecan, Männedorf, Switzerland).
ATP content measurement
Total B‐ and T‐cells were sorted from spleens of mice and washed twice with cold PBS. Four‐million cells were pelleted, and the pellet was snap‐frozen in liquid nitrogen and stored until further experiment at −70°. The pellet was thawed on ice, and the cells were lysed in 40 μl boiled autoclaved water and further boiled on a heating block for 10 min. Samples were then incubated on ice for 3 min followed by centrifugation at 10 000 g for 15 min at 4°; 20 μl of diluted ATP standard in autoclaved MQ water and test samples at various dilutions were plated in duplicates in the 96‐well plate. Master reaction mix was prepared by mixing ATP assay mix (Sigma) and ATP dilution buffer [50 mm Tris‐HCl (pH 7·8), 0·01 m MgSO4, 1 mm dithiothreitol (DTT), 2 mm EDTA] in 1 : 60 ratio. Twenty‐five microlitres of master mix was dispensed in each well with Orion II microplate luminometer (Berthold) and luminescence was measured with the following parameters: dispense for 3 seconds, shake for 3 seconds, delay for 3 seconds and luminescence for 10 seconds. ATP concentration in the samples was determined from the standard curve. The readings were normalized with protein concentrations that were estimated with micro‐bicinchoninic acid kit (Pierce, Dallas, TX, USA).
Inhibitor assays
Two‐million spleen, thymus and bone‐marrow cells were incubated in the presence of 200 μm iodoacetate, 20 μm oligomycin or 100 μm anisomycin for 2 hr. Cells were then washed with PBS and stained for cell‐surface markers as previously described. After washing with PBS, cells were re‐suspended in 0·85% saline with 500 nm SYTOX green Nucleic Acid Stain (Invitrogen), and samples were maintained in the dark and on ice. Analysis was performed on BD FACS Verse or BD FACS ARIA (Becton and Dickinson).
Differential expression and pathway enrichment analysis
Previously published23 gene expression (microarray) data were obtained from Gene Expression Omnibus (GEO; Accession number GSE15907). For comparison of B‐ and T‐cell subsets, data were analysed using the Geo2R tool at GEO between splenic follicular B‐cells (three replicates) versus splenic naïve CD4 and naïve CD8 T‐cells (three replicates each). For other subset‐pair comparisons, the classification given in Table S5 was used. Differentially expressed genes were defined as those with adjusted P‐value < 0·1 after multiple corrections. This relatively high threshold for false discovery rate (FDR) was set to not miss biologically important genes with lower fold changes or borderline P‐values that may otherwise be missed in the presence of much more significant gene expression differences between lineages. Pathway enrichment was performed against the curated custom gene sets (provided in Table S2) using a hypergeometric test,27 and a FDR adjusted P‐value of < 0·1 was considered significant. Enrichment scores for each gene set were calculated as (ratio of number of supp genes in the gene set that are differentially expressed to the number of differentially expressed genes considered) divided by (ratio of number of genes in the gene set to the total number of genes in the microarray). All analyses were done using custom scripts in R version 3.4.2 available on request.
Ribosome profiling and data analysis
Ribosome profiling was done as described previously.28 In short, 60 × 106 resting B‐ and T‐cells were sorted using MACS, followed by incubation with 100 μg/ml cycloheximide for 15 min. Cells were harvested, lysed in lysis buffer [20 mm Tris Cl pH 7·4, 150 mm NaCl, 5 mm MgCl2, 1 mm DTT, 20 mg/ml cycloheximide, 1% Triton X‐100, 0·2% Na‐deoxycholate, 2·5 m PMSF, 40 U/ml Superase.in (Thermo Fisher, Waltham, MA, USA), 1 × complete protease inhibitors without EDTA (Roche)]. Extracts were cleared by centrifugation and treated with a combination of RNases (RNase A, Fermentas; RNase T1, Worthington; S7 nuclease; Sigma) for 45 min on ice. Monosomes were isolated using Gradient Station (Biocomp Instruments, Fredericton, Canada) and RNA was purified, followed by size selection (25–35 nt), adapter ligation, reverse transcription, circularization and polymerase chain reaction (PCR) amplification of the libraries. Barcoded libraries were sequenced in Illumina HiSeq 2500.
After quality control (FastQC), the adapters were removed and reads were aligned to mouse rRNA genome using Bowtie.29 Unaligned sequences were mapped to the mouse genome using Tophat.30 The count table was generated using HTseq.31 Differential expression was analysed using DEseq2.32 Gene set enrichment analysis was done using GSEA33 and clusters were visualized using Cytoscape.34 To estimate translation efficiency (TE), RNA‐seq experiment was performed with corresponding samples, and the data were quality controlled and mapped to mouse genome as described for ribosome profiling data. The R package Ribodiff35 was used to estimate the TE.
Statistical analysis
Wherever mentioned in figure legends, data have been compared by two‐tailed Mann–Whitney tests (unequal variance, non‐parametric) or by two‐tailed paired or unpaired ‘t’‐tests, and P < 0·05 was considered significant.
Results
Ex vivo unstimulated B‐ and T‐cells exhibit distinct energy metabolism patterns
We began looking for distinctions between B and T lineages by comparing glucose uptake between ex vivo unstimulated B‐ and T‐cells. When spleen cells from C57BL/6 mice were incubated with 2‐(N‐(7‐nitrobenz‐2‐oxa‐1,3‐diazol‐4‐yl)amino)‐2‐ deoxyglucose (NBDG), a fluorescent analogue of glucose for 30 min, glucose uptake in T‐cells was > twofold higher than that in B‐cells (Fig. 1a,b). Similarly, fatty acid uptake was also higher in T‐cells as estimated using BodipyC6,C9 (Fig. 1c,d). Consistent with this increased uptake of major energy sources by T‐cells, ATP levels in ex vivo purified T‐cells were much higher than those in B‐cells (Fig. 1e).
Figure 1.
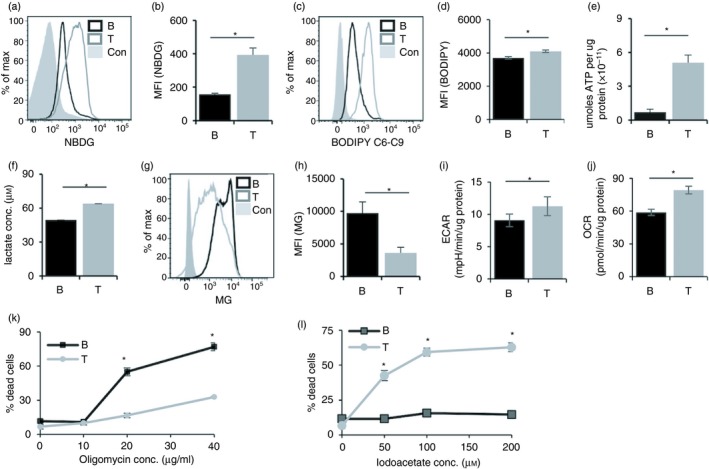
Functionally significant metabolic distinctions between peripheral B‐ and T‐cells. (a) Representative flow cytometry plot for gated B220+ (black line) and CD90+ (grey line) spleen cells cultured in 100 μm 2‐NBDG for 30 min. Grey histograms represent isotype control. (b) MFI quantification of (a) plotted as mean ± SE from nine mice. (c) Representative flow cytometry plot for Bodipy staining, gated for B220+ (Black line) and CD90+ (grey line). Grey histograms represent isotype control. (d) MFI quantification of (c) plotted as mean ± SE from three mice. (e) ATP content of sorted B220+ and CD90+ cells normalized to protein concentration. Data represent mean ± SE from five mice. (f) Lactate levels in the culture supernatants of sorted B‐and T‐cells. (g) Representative histogram overlays of gated CD90+ (grey line) or B220+ (black line) stained with Mitotracker green (MG). Filled histograms represent negative controls. (h) MFI from (g) plotted from nine individual mice. MFI represented as mean ± SE from nine mice. (i) Extracellular acidification rate (ECAR) of sorted B‐ and T‐cells. (j) Oxygen consumption rate (OCR) of sorted B‐ and T‐cells. Data represent mean ± SE from four mice. (k and l) % cell death of B‐ and T‐cells upon treatment with titrating concentrations of oligomycin and iodoacetate. CD90+ (grey line) or B220+ (black line). Data represented as mean ± SE from eight mice. *P < 0·05.
We next examined the relative prominence of mitochondrial oxidative phosphorylation and aerobic glycolysis. Ex vivo purified T‐cells produced higher levels of lactate, the end product of aerobic glycolysis (Fig. 1f). B‐cells exhibited higher mitochondrial mass as estimated using MG (Fig. 1g,h). When the OCR and ECAR were analysed, T‐cells exhibited higher levels of OCR as well as ECAR (Fig. 1i,j). We tested if these differences were functionally significant by measuring the relative sensitivity to cell death in response to inhibitors of various pathways. B‐cells were more sensitive to OXPHOS inhibition by oligomycin (Fig. 1k), while inhibition of glycolysis by iodoacetate led to more prominent cell death in T‐cells (Fig. 1l). These results suggest that the major carbon and/or energy source for T‐cells is glucose, consistent with the higher glucose uptake by these cells.
We analysed public transcriptome profiling data of mature B‐ and T‐cells from the immunological genome project 36 (GEO accession no. GSE15907). To test whether the differentially expressed genes found (Table S1) were enriched in metabolic pathways, we created curated lists of genes and pathways from the Kyoto Encyclopedia of Genes and Genomes (KEGG)36, 37 and gene ontology consortium38 related to our functional assays (Tables S2 and S3). We tested for enrichment of each gene list in the top differentially expressed genes between B‐ and T‐cells, and found that the gene sets ‘ABC transporters’, ‘glycolysis’, ‘protein synthesis’, ‘oxidative phosphorylation’ and ‘mitochondrial membrane potential’ were significantly enriched (FDR P‐values < 0·1; Table S4; Figs S1 and S2).
Among each category of these gene sets, some genes showed high expression in B‐cells while other genes showed high expression in T‐cells (Fig. S2). For example, among the glycolysis genes, fatty aldehyde dehydrogenase (ALDH3A2), dihydrolipoyl dehydrogenase (DLD), acetyl‐coenzyme A synthetase 2‐like (ACSS1), phosphoenol pyruvate carboxykinase (PCK2), aldehyde dehydrogenase (ALDH2) and aldolase fructose bisphosphonate (ALDOC) showed higher expression in B‐cells. On the other hand, genes such as phosphoglycerate kinase 1 (PGK1), hexokinase‐1 (HK1), alpha‐enolase (Eno1), lactate dehydrogenase (LDHA, LDHB), pyruvate dehydrogenase (PDHA1) and phosophoglucomutase‐1 (PGM1) showed higher expression in T‐cells (Fig. S2). Higher LDH expression in T‐cells was also consistent with our findings of production of higher levels of lactate by T‐cells. Among ABC transporters, genes for the ABCG family of lipid transporters showed higher expression in T‐cell subsets (Fig. S2), consistent with our experimental findings of higher lipid uptake in T‐cells. Higher sensitivity to oligomycin (an ATPase inhibitor) in B‐cells was consistent with lower expression of genes coding the ATPase complex (ATP5G2, ATP5J, ATP5D) in B‐cells compared with T‐cells (Fig. S2). These results suggest that metabolic differences between T‐ and B‐cells may not be mediated by massive changes in gene expression of all genes in a given pathway, but rather fine‐tuned by quantitative regulation of individual genes in the pathway.
Differences in B‐ and T‐cell metabolism are established early in development
To address at what point during lineage differentiation these metabolic differences between B‐ and T‐cells are established, cells from bone marrow, thymus and spleen were examined for these metabolic parameters at various B‐ and T‐cell differentiation stages (gating strategies as shown in Fig. S3). Differences in glucose uptake started at early stages of T‐ and B‐cell differentiation. Pro‐B‐cells showed a modest but significantly lower glucose uptake compared with DN thymocytes (Fig. 2a). Glucose uptake further decreased in the pre‐B stage, while it increased in the analogous DP‐T‐cell stage. While there were slight increases in subsequent B‐cell stages, glucose uptake in naive B‐cells remained much lower than in the pro‐B stage (Fig. 2a). Naïve T‐cells showed lower NBDG uptake than SP‐T thymocytes. Taken together, it is apparent that there is a shift to lower levels of glucose uptake by B lineage cells, and that it is established during the pro‐B to pre‐B transition.
Figure 2.
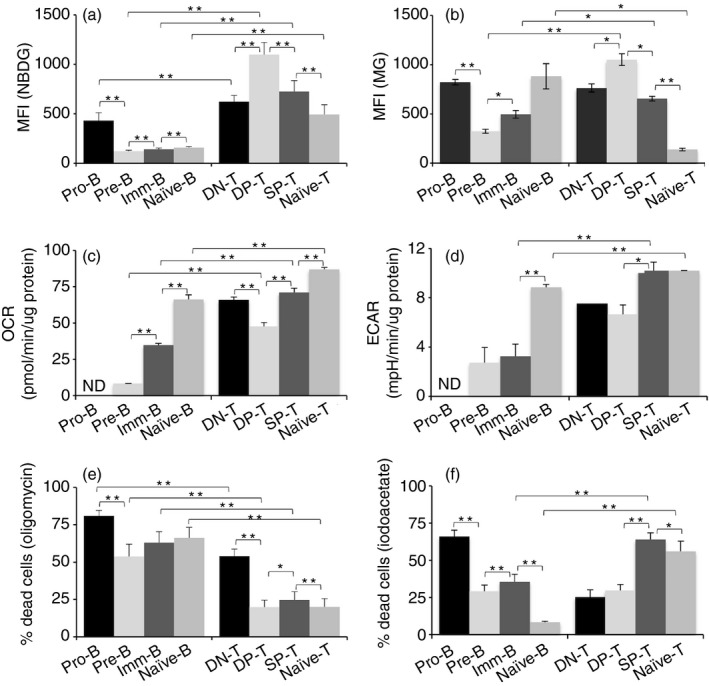
Differences in energy metabolism are established early during B and T lineage differentiation. (a) Ex vivo spleen, thymus and bone‐marrow cells were cultured in the presence of NBDG for 30 min and counterstained for cell‐surface markers to define subsets. (b) Spleen, thymus and bone‐marrow cells were stained with Mitotracker green (MG) and counterstained for cell‐surface markers. Data represent mean ± SE. n = 9 mice/group. (c and d) Different developmental stages were sorted from spleen, thymus and bone‐marrow, and oxygen consumption rate (OCR) (c) and extracellular acidification rate (ECAR) (d) were analysed. ND: not determined due to insufficient cell numbers. (e and f) Cell death in the presence of oligomycin (e) and iodoacetate (f) are shown. *P < 0·05, **P < 0·01.
The mitochondrial mass also varied during differentiation stages, and these transitions were quite different between B and T lineages (Fig. 2b). It reflected glucose uptake levels at the pre‐B/DP‐T stages (Fig. 2b). Notably, the most striking difference was the reduction in mitochondrial mass between SP‐T‐cells in the thymus and naive T‐cells in the periphery (Fig. 2b), corroborating with earlier findings,39 leading to the difference noted above between ex vivo B‐ and T‐cells (Fig. 1g,h).
T and B lineage stages were purified and examined for OCR and ECAR parameters. The T lineage exhibited a sharp decrease in OCR from the DN‐T to the DP‐T stage, followed by an increase in SP‐T stage and peripheral naïve T‐cells. On the other hand, ECAR values did not show any differences between the DN‐T and DP‐T stages, but showed an increase in later T lineage stages (Fig. 2c,d). While pro‐B‐cell numbers precluded sorting in sufficient numbers for meaningful analysis, both the OCR and the ECAR values showed gradual increases through B‐cell development from pre‐B‐cells to naive B‐cells (Fig. 2c,d). At every comparable stage of differentiation, T lineage cells showed higher OCR and ECAR values, consistent with their higher glucose uptake.
Next, we tested the relative sensitivity of T and B lineage cells at different developmental stages to cell death in response to inhibitors of OXPHOS or glycolysis. Inhibition of OXPHOS using oligomycin led to increased cell death in all B lineage stages, while T lineage stages were less affected (Fig. 2e). Interestingly, pro‐B‐cells exhibit high oligomycin‐induced cell death, as well as maximal sensitivity to cell death in response to inhibition of glycolysis with iodoacetate as well (Fig. 2f), indicating that both glycolysis and OXPHOS are important for pro‐B‐cells. It should be noted that, although oligomycin sensitivity declined in the B‐cell lineage beyond the pro‐B stage, all stages exhibited > 50% cell death (Fig. 2e). Among T lineage, DN‐T‐cells exhibited maximum sensitivity to oligomycin (> 50%) and least sensitivity to iodoacetate (~20%; Fig. 2e,f). Transition from the DP‐T stage to SP‐T‐cells was accompanied by increased sensitivity to iodoacetate (Fig. 2f).
These data indicated that as T‐cells mature, they become more dependent on glycolysis than OXPHOS, while the B lineage depends more on OXPHOS throughout differentiation.
Expression of metabolic genes are distinct in B and T lineages during development
To compare the levels of expression of genes related to metabolic pathways of our interest (Tables S2 and S3) in these B and T lineage stages, we utilized the gene expression (microarray) data of T and B subsets from the immunological genome project36 that mapped to the classification scheme we used (Table S5). The downloaded data satisfied quality control (Fig. S4a), with no outliers or batch effects (Fig. S4b). Genes from the metabolic pathways of our interest (Tables S2 and S3) assembled the subsets into distinct clusters on principal component analysis (PCA; Fig. 3a,b). The principal component 1 (PC1) separated the immature subsets from the mature subsets, and PC2 separated the B and T lineages (Fig. 3a). PC3 separated immature subsets from mature subsets in both T‐ and B‐cells, although less clearly than PC1 (Fig. S5). Together, PC1, PC2 and PC3 accounted for about 70% of the variance (Fig. 3b). When cell subsets were separated using Euclidean distances, subsets within a lineage and developmental stage clustered together (Fig. 3c). Feature extraction revealed that a total of 605 genes contributed to the first three PCs; with 335 genes contributing to PC1, 197 genes contributing to PC2, and 290 genes contributing to PC3 (Fig. 3d; Table S6). Interestingly, 38 genes contributed to all three PCs (intersecting portion in Fig. 3d), suggesting that these could contribute to biological differences across lineages as well as within lineages, and hence likely to be biologically interesting (Fig. S6). PCA‐extracted genes were also significantly differentially expressed, as shown in the significant overlap between these two gene lists (P‐value for overlap < 0·001 by hypergeometric test; Figs 3e and S6).
Figure 3.
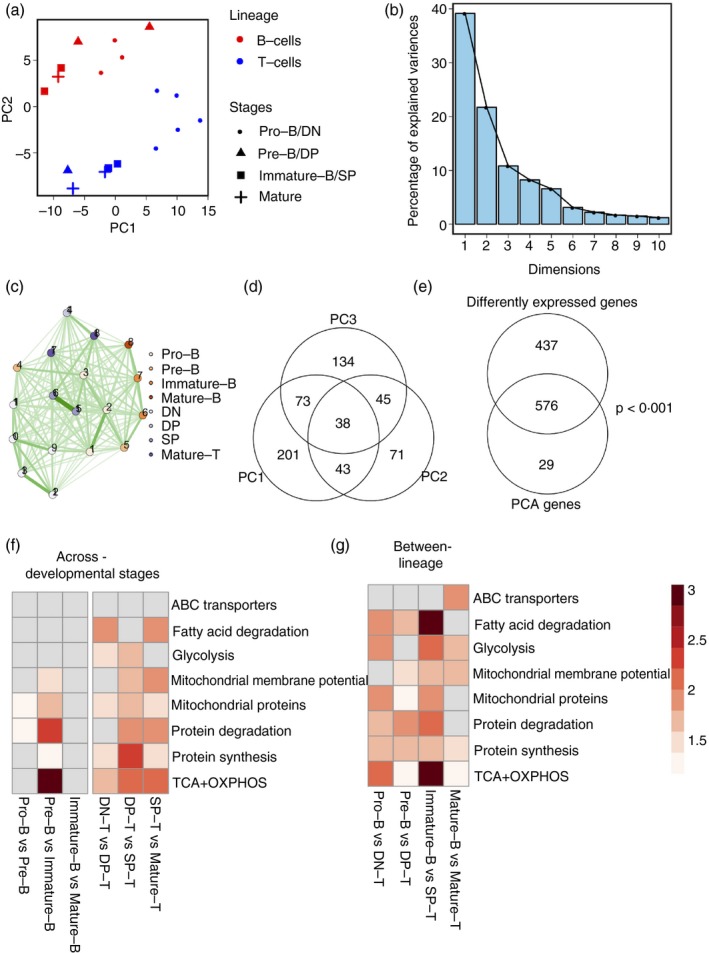
B and T lineage cells have divergent expression patterns of metabolic pathway genes. (a) Principal component analysis (PCA) of B and T development subsets according to gene expression in metabolism‐associated genes. PC1 versus PC2 plots showing clustering and separation of the two lineages and developmental stages when metabolism‐associated gene expression levels are considered. (b) Scree plots of (a) showing the percentage of variances explained by each PC. (c) Network map showing Euclidean distances between each cell subset based on expression of metabolism‐associated genes. Nodes represent cell subsets as indicated. Edges indicate the strength of connection, with darker lines indicating closer distances than lighter lines. (d) Overlap in genes that contribute to PC1, PC2 and PC3 indicated by the Venn diagram. (e) Significant overlap in genes differentially expressed between any two cell subsets and genes contributing to the first three PCs. (f) Heatmap showing enrichment scores of each metabolic pathway (rows) for inter‐lineage cell subset pairs (columns). Higher intensity of colour indicates higher enrichment scores. White cells represent no significant enrichment. (g) Heatmap showing enrichment scores of each metabolic pathway (rows) for each developmental transition in B‐cell and T‐cell lineage (columns). Higher intensity of colour indicates higher enrichment scores. White cells represent no significant enrichment.
When a GO enrichment analysis was done for PC1, PC2 and PC3 genes, keeping all metabolic genes as background, PC1 genes were enriched for ‘mitochondrial proteins’ (GO:0098798), specifically for ‘inner mitochondrial membrane localization’ (GO:0098800), whereas PC2 and PC3 genes were enriched for cytosolic localization (GO:0044445). PC2 genes were also enriched for ‘regulation of cytokine secretion’ (GO:0050707), ‘regulation of lipid metabolic process’ (GO:0019216) and ‘positive regulation of cellular protein metabolic process’ (GO:0032270). PC3 genes were also enriched for cytosolic localization (GO:0005737), and for the terms ‘endopeptidase regulator activity’ (GO:0061135) and ‘regulation of protein metabolic process’ (GO:0051246). The finding that PC2 genes are enriched in cytokine secretion and in lipid metabolic processes correlates with PC2 representing the B versus T separation.
In order to analyse changes in metabolism‐related gene expression during consecutive developmental stages within a lineage as well as similar developmental stages across lineages (Table S7), we tested the top differentially expressed genes characterizing each transition for enrichment against the curated gene sets of our interest. For each developmental transition in B‐ and T‐cells, the significantly enriched pathways (FDR < 0·1) were scored according to the degree of enrichment measured by enrichment score (details of calculation in methods; Fig. 3f; Table S8). T‐cell developmental transitions are more dynamic with accompanied metabolic transitions at each stage, from DN to DP, DP to SP, and SP to mature T‐cell stages in various pathways, as shown in Fig. 3(f). On the other hand, in the B‐cell development trajectory, the most substantial metabolic changes occur with the pre‐B to immature B transition; the highest changes were observed in ‘TCA + OXPHOS’ genes, genes associated with ‘mitochondrial membrane potential’, ‘mitochondrial proteins’ and ‘protein degradation’. Together with the data showing that pre‐B‐cells exhibited the least glucose uptake and OCR, these gene expression data suggested that the pre‐B stage may be a metabolic hinge during B‐cell differentiation.
Comparison of corresponding developmental stages of B and T lineages revealed that each stage of these lineages exhibit differences in most pathways analysed (Fig. 3g). Consistent with the experimental findings (Figs 1 and 2), differences in ‘glycolysis’ and ‘TCA + OXPHOS’ were consistently seen across all B and T developmental stages (Fig. 3g). Interestingly, genes associated with protein synthesis and degradation were also significantly enriched in the genes differentially expressed among B and T lineages (Fig. 3f).
Resting B‐cells exhibit higher levels of protein synthesis
Because protein synthesis is one of the most energy‐consuming cellular processes,40 we analysed the uptake of tritiated leucine to estimate the rate of protein synthesis in resting B‐ and T‐cells. Interestingly, B‐cells showed higher levels of tritiated leucine incorporation compared with T‐cells, indicating higher protein synthesis (Fig. 4a). We confirmed this with a flow cytometric assay (Fig. 4b,c), in which cells were cultured in medium containing the amino acid analogue HPG, followed by detection of incorporated HPG using click chemistry coupling to a fluorescent azide for flow cytometric detection.41 Using this assay, it was evident that all stages of the B lineage exhibited higher protein synthesis rates compared with the T‐cell lineage (Fig. 4d). We also found that all stages in the B‐cell lineage were much more sensitive than T lineage stages to cell death via anisomycin, an inhibitor of protein synthesis (Fig. 4e). Taken together, these results suggest that despite lower glucose uptake, B‐cells have a higher protein synthesis rate, which is required for B‐cell survival.
Figure 4.
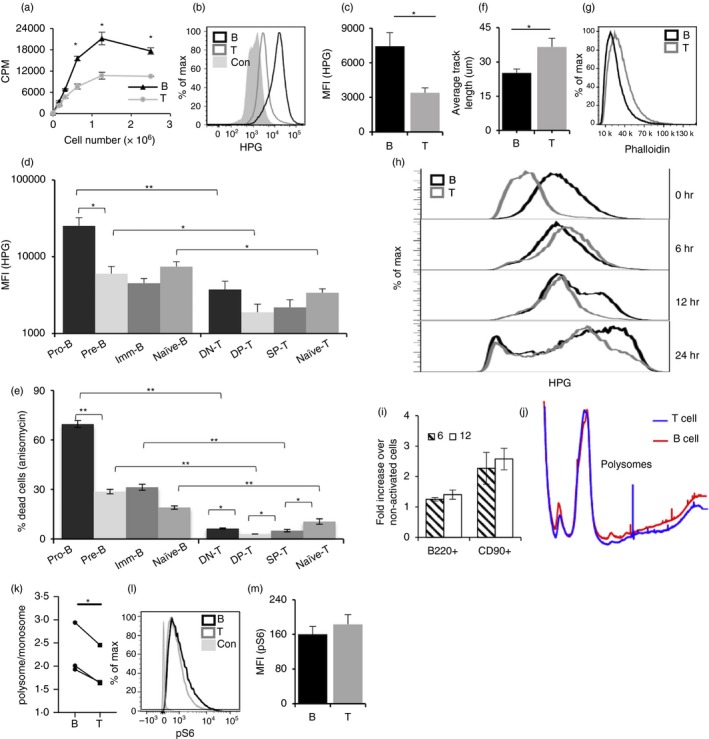
B‐cells exhibit higher protein synthesis, while T‐cells exhibit higher cell motility. (a) Quantitation of uptake of tritiated leucine by B‐ and T‐cells. (b) Representative flow cytometry plot for l‐homopropargylglycine (HPG) uptake by B‐ and T‐cells. (c) MFI for HPG uptake from (b) quantified and data represented as mean ± SE from nine mice. (d) HPG uptake by developmental intermediates of B‐ and T‐cells. (e) Sensitivity of B‐ and T‐cell intermediates to anisomycin. (f) Motility of sorted B‐ and T‐cells on cultured bone‐marrow‐derived dendritic cells (BMDCs). Data represent average track length ± SE traversed by B‐ and T‐cells in 1 hr in 35–40 individual cells. (g) Actin levels in B‐ and T‐cells measured by Phalloidin. B220+ (black line) and CD90+ (grey line). (h) HPG incorporation of B‐ and T‐cells without activation, upon activation for 6, 12 and 24 hr. (i) MFI from (h) plotted from three individual mice. MFI represented as mean ± SE from 3 mice; 6 hr (filled) and 12 hr (open) histograms. (j) Polysome profile comparison of B‐ and T‐cells. Red traces show B‐cell polysome profile, and blue traces show T‐cell profile. The profiles were normalized for monosome peak height (80 S). (k) Polysome : monosome ratios are shown for B‐ and T‐cells. The data represent three independent experiments and are shown as mean ± SEM (*P < 0·05 in a two‐tailed paired ‘t’‐test). (l) MFI for pS6 expression from (k) quantified and data represented as mean ± SE from nine mice. *P < 0·05, **P < 0·01.
Thus, it appeared that, while peripheral T‐cells showed higher glucose uptake, they showed lower rates of protein synthesis. As the peripheral B‐ and T‐cells ex vivo used in this study are not in cell cycle, we speculated that this marked difference could be plausibly correlated with functional differences between them. Activation of T‐cells depends on the extensive scanning of antigen‐presenting cells (APCs), such as dendritic cells (DCs).42, 43, 44 While B‐cell activation can also involve some cell movement in the secondary lymphoid organs,45 they bind directly to target antigens in extracellular fluid in vivo.46 Thus, cell motility appears to be an important and potentially differential factor in recognition of antigen and activation of T versus B lymphocytes. We therefore asked if B‐ and T‐cells differed in their motility. Cell motility assays performed with sort‐purified peripheral B‐ and T‐cells cultured on BMDCs showed that the average length traversed in 1 hr was higher for T‐cells than B‐cells (Fig. 4f). In support of this, phalloidin staining of B‐ and T‐cells showed higher F‐actin content in T‐cells (Fig. 4g). These results, showing that T‐cells exhibited higher motility, appeared consistent with their higher glucose uptake.
The higher protein synthesis observed in resting B‐cells compared with resting T‐cells also prompted us to follow this difference consequent to activation. HPG incorporation was assayed in peripheral B‐ and T‐cells activated for 6, 12 and 24 hr using either lipopolysaccharide (LPS) or anti‐CD3+ anti‐CD28, respectively. At 6 hr post‐activation, T‐cells showed a drastic increase in HPG incorporation, while B‐cells exhibited only a marginal increase (Fig. 4h,i). Interestingly, as a result, HPG incorporation levels were now comparable between B‐ and T‐cells. At longer times post‐activation, both B‐ and then T‐cells began to show even higher levels of HPG incorporation (Fig. 4h,i), presumably consistent with further cell cycle stages.
Next, we tested if the increased amino acid uptake by B‐cells is also reflected in their polysome levels. Indeed, B‐cells have higher polysome levels compared with T‐cells (Fig. 4j), and the polysome : monosome ratio was modestly but significantly higher in B‐cells (Fig. 4k). An increase in protein synthesis in response to a stimulus or proliferation is generally associated with activation of the mTOR pathway. One of the downstream targets of the mTOR pathway is the phosphorylation of the ribosomal protein S6. We examined phospho‐S6 levels in B‐ and T‐cells, and found no differences (Fig. 4k,l), suggesting that the mTOR pathway was not differentially activated in resting B‐cells.
Genes undergoing higher protein synthesis in B‐cells are broadly distributed
To further characterize the protein synthesis landscape in B‐ and T‐cells, we performed a coupled ribo‐seq‐RNAseq study. Ribo‐seq provides a snapshot of the translatome where the normalized read counts indicate levels of translation of mRNA (Table S9), while RNA‐seq provides a measure of the relative steady‐state levels of mRNAs in the transcriptome. Our RNA‐seq data were in agreement with the microarray data used for the analyses above (Figs 3 and S7). We next asked if the cellular transcriptome was broadly represented in the B‐cell translatome. Scatterplots comparing the RNA‐seq and ribo‐seq read counts for B‐cells exhibited good positive correlation [Pearson's correlation coefficient (PCC) = 0·69; Fig. 5a], indicating that total mRNA levels drive the ribosome occupancy. T‐cells also showed a positive correlation between RNA‐seq and ribo‐seq read counts, albeit lower than that of B‐cells (PCC = 0·39; Fig. 5b). Cumulative distribution of TEs of B‐ and T‐cells (Table S10) rules out the possibility that the mRNAs in B‐cells have an overall increase in TE (Fig. 5c). These data suggested that the cellular transcriptome was broadly represented in the higher levels of mRNA translation in B‐cells.
Figure 5.
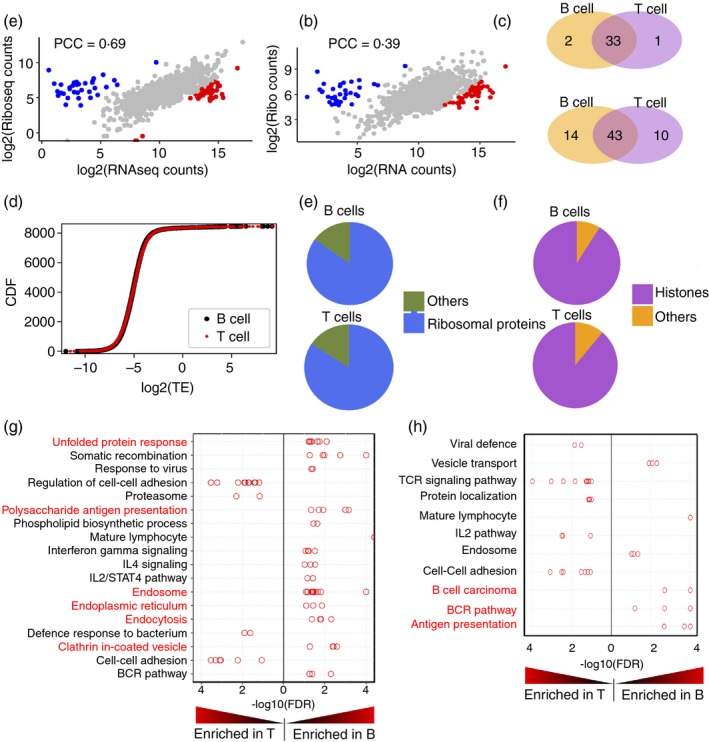
Distinctions in the translatomes and transcriptomes of B‐ and T‐cells. (a and b) Scatter plots showing comparison of normalized RNA‐seq counts and ribosome profiling (ribo‐seq) counts for B‐cells (a) and T‐cells (b). (c) A scatter plot showing the translation efficiency (TE) of mRNAs in B‐ and T‐cell translatomes. (d) Venn diagrams showing the overlap between the gene sets with highest TE (upper panel) and lowest TE (lower panel) in B‐ and T‐cells. (e and f) Pie charts showing the distribution of genes in low TE set (e) and high TE set (f). (g and h) Distribution of ‐log10(P‐value) of gene sets associated with groups identified by Enrichment Map and Autoannotate in ribo‐seq (g) and RNA‐seq (h). Red font indicates the groups that are involved in antigen internalization and presentation.
However, the small subgroups of mRNAs that exhibited the highest and lowest TE in each cell type existed as two distinct populations in the scatterplots comparing mRNA‐seq and ribo‐seq reads (Fig. 5a,b; blue and red dots). One group showed relatively lower mRNA‐seq reads and higher ribo‐seq reads, while the second group exhibited relatively lower ribo‐seq reads and higher RNA‐seq reads. We examined the composition of these two populations in B‐ and T‐cells. High‐TE (Fig. 5d; upper panel) and low‐TE (Fig. 5d; lower panel) genes overlapped considerably in B‐ and T‐cells, suggesting that these are common features of resting lymphocytes.
Many of the genes showing the lowest TE (Fig. 5a,b; blue dots) are those coding for ribosomal proteins in both cell types (Fig. 5e), while those showing high TE are mostly histone‐coding genes (Fig. 5f). The high TE of histone‐coding mRNAs in these cells is consistent with the well‐known mechanisms of mammalian histone gene expression control.47 Replication‐associated histones are produced only in the S phase of the cell cycle, though their mRNAs are generated throughout the cell cycle. Outside the S phase, these mRNAs are degraded in a translation‐dependent manner. Because these mRNAs are degraded immediately upon initial translation, the ratio of ribo‐seq reads to RNA‐seq reads is likely to be relatively higher, which would be interpreted as a high TE. The TE of ribosomal protein mRNAs is regulated by mTOR via 4EBP, and mTOR activation occurs in lymphocytes after stimulation.48 The reduced TE for these mRNAs in resting B‐ and T‐cells could be due to the relatively low baseline mTOR activity in these cells.
Resting B‐ and T‐cells show different functionally significant elements in their translatomes
To explore the functional significance of higher protein synthesis levels in B‐cells, we further analysed the mRNAs that were relatively enriched in B‐cell or T‐cell translatomes. We subjected the ribosome profiling data to gene set enrichment analysis (GSEA),33 followed by clustering and annotation using Enrichment Map33, 49 and Autoannotate34 in Cytoscape. Apart from TCR and TCR signalling genes, the major gene sets enriched in T‐cells were those involved in cell–cell adhesion and the regulation of cell–cell adhesion (Fig. 5g). The TEs of genes belonging to these groups were not significantly enriched, and several of these gene sets were also enriched in the RNA‐seq data (Fig. 5h), suggesting a transcriptional level of control of gene expression. The higher expression of genes associated with cell–cell interaction was consistent with APC‐scanning by T‐cells, and with their higher motility on APCs as above.
A similar analysis of mRNAs enriched in the B‐cell translatome revealed gene sets primarily associated with vesicular traffic networks. The prominent groups found in the ribo‐seq data were endocytosis, phagocytosis, clathrin‐coated vesicles, endoplasmic reticulum, Golgi and unfolded protein response (Fig. 5g), as well as MHC class II (MHCII); processes related to antigen internalization via BCR, processing and MHCII‐mediated presentation. As in the case of T‐cells, many of these gene sets are also enriched in the RNA‐seq dataset as well, indicating their control at the transcriptional level.
AIF hypomorphism results in metabolic alterations only in T lineage cells
We have previously shown that AIF hypomorphism in Hq mice leads to a T‐cell lineage, but not B‐cell lineage, deficiency with T‐cell development halted during the DN to DP transition due to its defective oxido‐reductase function.16, 50, 51 The mitochondrial role of AIF has been specifically shown to be important for T‐cells and not B‐cells.17 We tested if the metabolic differences observed above between B‐ and T‐cell lineages were altered due to AIF hypomorphism.
We began by estimating the degree of correlation in gene expression between Aif (Aifm1) and the metabolism‐associated genes selectively expressed in B‐cells or T‐cells (Table S1). For this, we used the resource ‘Immuno‐navigator’,52 a gene co‐expression database for immune cell subsets. PCCs of each top differentially expressed lineage‐specific gene with Aifm1 for B‐cells and T‐cells were plotted as a cumulative distribution function (Fig. 6a). The top differentially expressed genes (black dots, Fig. 6a,c) showed a shift to the right (higher PCC values, positive correlation) compared with other genes in CD4 and CD8 cells (Fig. 6b,c), but not in B‐cells (Fig. 6a), indicating an enrichment in genes highly correlated with Aif in the CD4 and CD8 cells. The enrichment is also evident in ‘barcode plots’33 (Fig. 6d,f) showing the location of differentially expressed genes (vertical lines in the lower half) when all the genes were rank‐ordered according to their correlation with Aifm1. While in B‐cells the metabolic genes were spread uniformly (with a slight enrichment towards the ends; Fig. 6d), in CD4 and CD8 cells, the metabolic genes showed a clear grouping of vertical lines closer to the right side (the side with higher PCC values; Fig. 6e,f). This density was reflected in density histograms (upper half, Fig. 6d,f). When genes were rank‐ordered according to their PCC values [highest rank (rank 1) corresponding to highest PCC values with positive correlation], B‐cell‐expressed metabolism genes tended to be ranked lower than T‐cell‐expressed metabolism genes in terms of their mean ranks53 (Fig. 6g,h). The average rank of T‐cell‐specific metabolism genes in terms of their correlation with Aifm1 tended to be lower in CD4 (Fig. 6g) and CD8 (Fig. 6h) cells compared with B‐cell‐specific metabolism genes in B‐cells, suggesting that Aif was more ‘connected’ to T‐cell‐specific metabolism‐associated genes than to B‐cell‐specific metabolism‐associated genes. Thus, these analyses suggested that Aif hypomorphism would affect metabolism in the T‐cell lineage differently from the B‐cell lineage.
Figure 6.
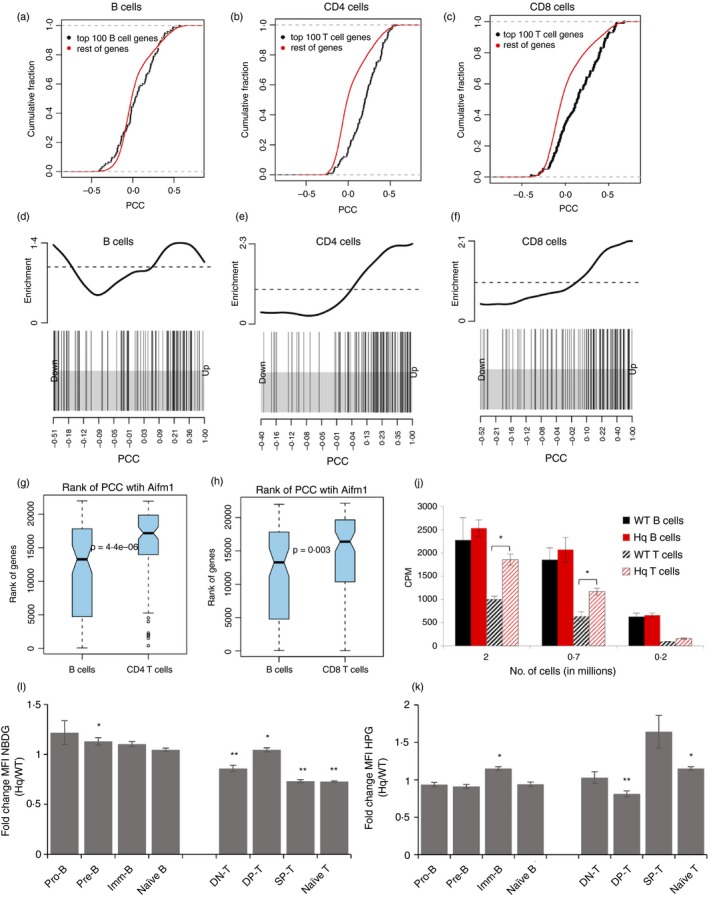
Apoptosis‐inducing factor (AIF) hypomorphism results in metabolic alterations only in T lineage cells. (a) Cumulative distribution function plots of Pearson correlation coefficient (PCC) of Aifm1 with top 100 B‐cell differentially expressed metabolism‐related genes (black dots) and with the rest of the genes (red) in the B‐cell lineage (P = 0·012). (b and c) Cumulative distribution function plots of PCC of Aifm1 with top 100 T‐cell differentially expressed metabolism‐related genes (black dots) and with the rest of the genes (red) in (b) CD4 lineage (P = 3·5e‐14) and (c) CD8 lineage (P = 1·5e‐07). (d) ‘Barcode plots’ indicating the position of top B‐cell expressed metabolism‐related genes in the ranked list of PCC statistics. PCC between Aifm1 and each gene (in B‐cell lineage) is ranked left to right from lowest to highest (x‐axis). The position of each of the top 100 B‐cell expressed metabolism‐related gene is indicated as a vertical line. The density of the vertical line is indicated in the upper part of the figure. (e and f): similar to (d), but showing the position of top 100 metabolism‐related T‐cell expressed genes in the ranked list of PCC for the (e) CD4 and (f) CD8 lineages. (g and h) Differentially expressed B‐ and T‐cell metabolism‐associated genes are rank ordered according to the PCC values (correlation of each gene with Aifm1) in each lineage separately. Density histograms showing different distributions in (b), CD4 and CD8 lineages. (i and k) Ex vivo spleen, thymus and bone‐marrow cells from wild‐type (WT) and Harlequin (Hq) mice were cultured in the presence of NBDG for 30 min (i) or l‐homopropargylglycine (HPG) for 2 hr (k), and counterstained for cell‐surface markers to define subsets. The ratio of Hq/WT MFI was calculated for each subset. (j) Sorted B220+ and CD90+ cells ere cultured for 12 hr with 3H‐leucine‐containing medium. Data represent mean ± SE of triplicate cultures. *P < 0·05, **P < 0·01.
We therefore tested glucose uptake at each stage of T‐ and B‐cell differentiation in wild‐type (WT) and Aif‐hypomorphic Hq mice. Glucose uptake was by and large lower in the Hq than WT T‐cell lineage, while it remained more or less unaltered in the B‐cell lineage (Fig. 6i). An interesting exception was the higher glucose uptake in DP‐T‐cells, a stage in which the Hq genotype showed a major defect during T‐cell development.16, 50 Tritiated leucine incorporation rates were comparable between peripheral WT and Hq B‐cells, whereas Hq T‐cells showed higher rates than WT T‐cells (Fig. 6j). The HPG incorporation was also higher in Hq T‐cells than in WT T‐cells, with comparable rates between WT and Hq B‐cells (Fig. 6k). Upregulation of HPG uptake in Hq T‐cell lineage began at the SP‐T‐cell stage (Fig. 6k). Thus, loss of function of a single constitutively expressed gene can differentially affect the metabolic landscape as well as development and function of these closely related lineages.
Discussion
We have previously shown that hypomorphism in AIF, a constitutively expressed gene coding for a mitochondrial oxido‐reductase, results in a T‐lineage‐specific defect while B‐cell development and function remains unaltered,16 leading us to hypothesize that constitutively expressed metabolic circuitry might be different in these two closely related lineages. In the present study, we demonstrate that ex vivo resting T‐cells have higher glucose and lipid uptake along with higher lactate generation corroborating with higher ECAR and OCR levels than peripheral resting B‐cells do. Thus, T‐cells appear to be more reliant on glycolysis, while resting peripheral B‐cells may rely more on mitochondria‐driven oxidative phosphorylation. This metabolic programming is functionally relevant, as B‐ and T‐cells show dramatically different susceptibilities to oligomycin‐ versus iodoacetate‐mediated cell death. Our analysis of the publicly available gene expression data supports these interpretations. While previous studies have focused mainly on metabolic alterations in B‐ and T‐cells post‐activation, one earlier study has reported no difference in OCR between resting B‐ and T‐cells, and a higher ECAR in B‐cells.54 This difference may likely be due to their use of B‐cell activating factor, a pro‐survival cytokine known to have effects on B‐cell metabolism.55, 56
Our results also follow the establishment of these differences during the development of these lineages. Early during lineage differentiation, the differences in the metabolic landscape between the B‐ and T‐cell lineages in terms of NBDG uptake, mitochondrial content and relative susceptibility to oligomycin‐ versus iodoacetate‐mediated cell death are relatively modest, in comparison to later stages of lineage differentiation, even though the stages themselves are closely analogous. The B‐cell lineage shows reduced NBDG uptake and remains susceptible to oligomycin, while the T‐cell lineage maintains NBDG uptake and loses oligomycin susceptibility. However, there are interesting differences in the changes in each lineage as well. When the various stages of B‐cell development are compared, the mitochondrial mass, ECAR and OCR also show their lowest levels in the pre‐B‐cells, despite the fact that proliferation prior to VDJ recombination and during heavy chain selection occurs during these transitions.57, 58, 59, 60 Mitochondrial mass is reduced in T lineage cells only at the last stage of post‐thymic maturation. Interestingly, proliferation of naive T‐cells upon activation also depends more on OXPHOS than aerobic glycolysis.23 The mechanisms and significance of these metabolic re‐wiring events during lineage developmental transitions are likely to be of great interest.
Aif hypomorphism in the immune system has consequences only in the T‐cell lineage, where mitochondrial function appears crucial. It is therefore possible that other metabolic changes may occur to compensate for Aif. In such a case, metabolism‐related genes crucial in T‐cells may show correlated co‐expression with Aif. As expected, Aifm1 is significantly co‐expressed with T‐cell cluster genes, and not with B‐cell cluster genes. This analysis suggests that although at a functional level we find clear‐cut differences in metabolic functions between cell lineages across developmental stages, this is not mediated at the gene‐expression level by differences in expression profiles along clear‐cut pathways, but rather by clusters of genes. Each lineage and developmental stage thus likely has what can be called a signature metabolic gene cluster that defines its metabolic profile at the functional level. If a molecule like AIF is well connected to the signature metabolic gene cluster specific to a lineage, disruption in AIF will affect only that lineage and will spare other lineages, even if AIF itself is expressed similarly across lineages. Our data also show that hypomorphic AIF expression results in modifications in glucose uptake as well as protein synthesis specifically in the T‐cell lineage. Increase in glucose uptake in the absence of AIF has been previously demonstrated in liver, muscle and cancer cells,61, 62 and confirms our finding in T‐cells.
Our data also show that the rate of constitutive protein synthesis ex vivo is significantly higher in resting B‐cells compared with resting T‐cells. Rates of protein synthesis in cells are known to be regulated by nutrient availability and by mitogens, primarily through the mTOR pathway. Both B‐ and T‐cells are known to activate mTOR after activation. Our findings that the phosphorylation of S6 protein, a downstream target of the mTOR pathway, is comparable between B‐ and T‐cells, and that the ribosomal protein‐coding mRNAs, well‐known targets of the mTOR pathway, possess the lowest TE in both cell types, indicate that the contribution from the mTOR pathway may be negligible in leading to the observed higher protein synthesis in B‐cells. Comparisons of the translatome and transcriptome of peripheral B‐ and T‐cells rule out gene‐specific translational upregulation as the major contributing factor for the increased protein synthesis rate in B‐cells. In other words, B‐cells show a globally high level of protein synthesis.
Internalization of antigen‐BCR complexes and antigen presentation by B‐cells occur within 2–8 hr post‐activation.63, 64, 65 Activated B‐cells upregulate their translation in phases only after this time window.66 The lack of increase in protein synthesis rates in B‐cells in the first 6 hr of activation suggests that resting B‐cells may already maintain protein synthesis to sustain immediate events after activation. In support of this, the mRNAs that are maximally translated in resting B‐cells are part of the vesicular trafficking network, which are required for antigen internalization, processing and presentation on the surface. Apart from B‐cells, macrophages and DCs constitute two major APC lineages. Interestingly, the kinetics of antigen presentation is much faster in macrophages compared with B‐cells,67 and upon activation with LPS, macrophages immediately increase their protein synthesis.68 Unlike B‐cells, protein synthesis in DCs also increases dramatically upon stimulation with LPS within 4 hr.69 Moreover, in contrast to B‐cells, which show a sharp increase in protein synthesis after 12 hr of activation, DCs show a decrease in protein synthesis beyond 4 hr of activation.66 It is apparent from these observations that the dynamics of protein synthesis in B‐cells is different from other professional APCs, which may influence the differences in kinetics of antigen presentation. Taken together, the protein synthesis landscape of resting B‐cells appears to be poised for antigen internalization and presentation, and further studies are required to delineate its role on the kinetics of B‐cell response.
T‐cell migration is a prerequisite for T‐cell responses,70 and aerobic glycolysis is essential for T‐cell motility post‐activation.71 Each T‐cell expresses a unique TCR, and it is estimated that 1 out of 105–106 T‐cells is specific for an antigen.72 The frequency of specific individual cognate peptide‐MHC complexes is low and, for productive encounters to occur, T‐cells must search and scan many APCs rapidly. Our data show that even non‐activated T‐cells are more motile than B‐cells. As cell motility is an energy‐intensive process, this difference is consistent with a 10‐fold higher ATP production in the more motile T‐cells as compared with B‐cells, which do not rely on cell–cell contact for antigen encounter. Aerobic glycolysis, and not mitochondrial ATP, has been found to be essential for motility in other cell types as well, and has been associated with fluctuations in membrane pump.27, 73
T‐cell‐mediated functions have to be mediated on location with cell–cell contact, while effector functions of B‐cells, namely, antibody production, can be mediated at a distance. Thus, it is likely that T‐cells function in a wide variety of limiting and metabolically diverse microenvironments. The ability of T‐cells to thrive by major reliance on glycolysis would also enable them to survive under the hypoxic conditions found in many target microenvironments such as chronic inflammatory sites or solid tumours, with high lactate content74 and a predominance of T‐cells over B‐cells.75 Our study thus underlines a number of previously under‐appreciated metabolic distinctions between B‐ and T‐cells that are likely to be of substantial functional relevance in disease microenvironments.
Disclosure
SR is a non‐executive director of Ahammune Biosciences Private Limited, Pune, India, and a member of the scientific advisory boards of Curadev Pharma Private Limited, NOIDA, India, and Mynvax Private Limited, Bangalore, India. Other authors have no financial interests to declare.
Supporting information
Figure S1. Pathway enrichment of differentially expressed genes, plotted as enrichment score (details of calculation in methods) versus negative log P‐value.
Figure S2. Heatmap showing differential expression of genes from enriched pathways (from Fig. S1) in B‐ and T‐cells.
Figure S3. Gating strategy for B‐ and T‐cell subsets in thymus, bone marrow and spleen.
Figure S4. Box plots (a) and clustering (b) of Immgen subsets based on microarray data.
Figure S5. Contribution of PC3 in separating immature and mature B‐ and T‐cell subsets.
Figure S6. Heatmap of gene expression in all T‐ and B‐subsets based on genes that contributed to all three principal components.
Figure S7. RNAseq data (this study) and public microarray data (from Immgen database) for resting B‐ and T cells‐correlate.
Table S1 List of genes differentially expressed between splenic follicular B‐cells and splenic naive T‐cells.
Table S2 List of KEGG pathways related to this study.
Table S3 List of genes associated with pathways listed in Table S2.
Table S4 Enrichment score of the differentially expressed genes for the KEGG pathways in Table S2.
Table S5 List of microarray data sets downloaded from the immunological genome project for developmental stage comparison.
Table S6 PCA analysis results shown in Fig. 3.
Table S7 Results of the pairwise analysis of developmental stage‐specific gene expression.
Table S8 Enrichment scores for gene sets between developmental stages.
Table S9 Ribosome profiling differential expression results.
Table S10 TEs calculated by Ribodiff package.
Acknowledgements
The authors thank Mr Inder Jit Singh for extensive help with animal breeding and maintenance, and Mr Rajesh Kumar for helping with cell sorting experiments. The authors are grateful to Dr Syamal Roy and Dr Sibsankar Roy, IICB, Kolkata, who provided their generous help in performing some experiments critical to the manuscript.
JKK planned and performed critical experiments, analysed data, wrote the manuscript, and shares senior authorship. ASC helped in planning, performing and analysing some key experiments critical for the study. SBP helped in bioinformatic analysis and in writing the manuscript. ASC and SBP are equal second authors. MV, AD, GD, ND, SD, ST and HB helped in performing some key experiments. GAA planned, performed and analysed critical experiments requiring key technology and expertise. AG, VB, JMD, SR and GAA conceived the questions and approach, planned experiments, analysed data, wrote the manuscript, and share senior authorship. All authors read and approved the final manuscript.
The study was supported in part by grants from the Department of Biotechnology, (DBT), Government of India (to AG # BT/PR12849/MED/15/35/2009; to VB # BT/PR14420/Med/29/213/2010; and to SR # BT/PR‐14592/BRB/10/858/2010), and from the Department of Science and Technology (DST), Government of India (to VB # SR/SO/HS‐0005/2011 and #EMR/2015/001074; to SR #SB/SO/HS/210/2013; to GAA #ECR/2017/000115), from the Arkansas Biosciences Institute (to JMD), and by a DST Ramanujan Fellowship (to GAA). The National Institute of Immunology is supported by the Department of Biotechnology, Government of India.
Contributor Information
Jasneet Kaur Khalsa, Email: JKHALSA@bwh.harvard.edu.
Jeannine Marie Durdik, Email: jdurdik@uark.edu.
Vineeta Bal, Email: vineeta@nii.ac.in.
Anna George, Email: anna@nii.ac.in.
Satyajit Rath, Email: satyajit@nii.ac.in.
Gopalakrishnan Aneeshkumar Arimbasseri, Email: aneesh@nii.ac.in.
References
- 1. Kondo M, Weissman IL, Akashi K. Identification of clonogenic common lymphoid progenitors in mouse bone marrow. Cell 1997; 91:661–72. [DOI] [PubMed] [Google Scholar]
- 2. LeBien TW, Tedder TF. B lymphocytes: how they develop and function. Blood 2008; 112:1570–80. [DOI] [PMC free article] [PubMed] [Google Scholar]
- 3. Rothenberg EV, Kueh HY, Yui MA, Zhang JA. Hematopoiesis and T‐cell specification as a model developmental system. Immunol Rev 2016; 271:72–97. [DOI] [PMC free article] [PubMed] [Google Scholar]
- 4. Krueger A, Ziętara N, Łyszkiewicz M. T cell development by the numbers. Trends Immunol 2017; 38:128–39. [DOI] [PubMed] [Google Scholar]
- 5. Delmastro‐Greenwood MM, Piganelli JD. Changing the energy of an immune response. Am J Clin Exp Immunol 2013; 2:30–54. [PMC free article] [PubMed] [Google Scholar]
- 6. Hayden MS, Ghosh S. NF‐κB in immunobiology. Cell Res 2011; 21:223–44. [DOI] [PMC free article] [PubMed] [Google Scholar]
- 7. von Freeden‐Jeffry U, Vieira P, Lucian LA, McNeil T, Burdach SE, Murray R. Lymphopenia in interleukin (IL)‐7 gene‐deleted mice identifies IL‐7 as a nonredundant cytokine. J Exp Med 1995; 181:1519–26. [DOI] [PMC free article] [PubMed] [Google Scholar]
- 8. Sauer K, Cooke MP. Regulation of immune cell development through soluble inositol‐1,3,4,5‐tetrakisphosphate. Nat Rev Immunol 2010; 10:257–71. [DOI] [PMC free article] [PubMed] [Google Scholar]
- 9. Hoffmann R, Bruno L, Seidl T, Rolink A, Melchers F. Rules for gene usage inferred from a comparison of large‐scale gene expression profiles of T and B lymphocyte development. J Immunol 2003; 170:1339–53. [DOI] [PubMed] [Google Scholar]
- 10. Bjur E, Larsson O, Yurchenko E, Zheng L, Gandin V, Topisirovic I et al Distinct translational control in CD4+ T cell subsets. PLoS Genet 2013; 9:e1003494. [DOI] [PMC free article] [PubMed] [Google Scholar]
- 11. Piccirillo CA, Bjur E, Topisirovic I, Sonenberg N, Larsson O. Translational control of immune responses: from transcripts to translatomes. Nat Immunol 2014; 15:503–11. [DOI] [PubMed] [Google Scholar]
- 12. Araki K, Morita M, Bederman AG, Konieczny BT, Kissick HT, Sonenberg N et al Translation is actively regulated during the differentiation of CD8+ effector T cells. Nat Immunol 2017; 18:1046–57. [DOI] [PMC free article] [PubMed] [Google Scholar]
- 13. Hibi T, Dosch H‐M. Limiting dilution analysis of the B cell compartment in human bone marrow. Eur J Immunol 1986; 16:139–45. [DOI] [PubMed] [Google Scholar]
- 14. Boothby M, Rickert RC. Metabolic regulation of the immune humoral response. Immunity 2017; 46:743–55. [DOI] [PMC free article] [PubMed] [Google Scholar]
- 15. Freitag J, Berod L, Kamradt T, Sparwasser T. Immunometabolism and autoimmunity. Immunol Cell Biol 2016; 94:925–34. [DOI] [PubMed] [Google Scholar]
- 16. Banerjee H, Das A, Srivastava S, Mattoo HR, Thyagarajan K, Khalsa JK et al A role for apoptosis‐inducing factor in T cell development. J Exp Med 2012; 209:1641–53. [DOI] [PMC free article] [PubMed] [Google Scholar]
- 17. Milasta S, Dillon CP, Sturm OE, Perry SS, Thomas PG, Green Correspondence DR. Apoptosis‐inducing‐factor‐dependent mitochondrial function is required for T cell but not B cell function. Immunity 2016; 44:88–102. [DOI] [PMC free article] [PubMed] [Google Scholar]
- 18. Simsek T, Kocabas F, Zheng J, DeBerardinis RJ, Mahmoud AI, Olson EN et al The distinct metabolic profile of hematopoietic stem cells reflects their location in a hypoxic niche. Cell Stem Cell 2010; 7:380–90. [DOI] [PMC free article] [PubMed] [Google Scholar]
- 19. Mendoza A, Fang V, Chen C, Serasinghe M, Verma A, Muller J et al Lymphatic endothelial S1P promotes mitochondrial function and survival in naive T cells. Nature 2017; 546:158–61. [DOI] [PMC free article] [PubMed] [Google Scholar]
- 20. Ganeshan K, Chawla A. Metabolic regulation of immune responses. Annu Rev Immunol 2014; 32:609–34. [DOI] [PMC free article] [PubMed] [Google Scholar]
- 21. Pearce EL, Pearce EJ. Metabolic pathways in immune cell activation and quiescence. Immunity 2013; 38:633–43. [DOI] [PMC free article] [PubMed] [Google Scholar]
- 22. Lunt SY, Vander Heiden MG. Aerobic glycolysis: meeting the metabolic requirements of cell proliferation. Annu Rev Cell Dev Biol 2011; 27:441–64. [DOI] [PubMed] [Google Scholar]
- 23. Chang C‐H, Curtis JD, Maggi LB, Faubert B, Villarino AV, O'Sullivan D et al Posttranscriptional control of T cell effector function by aerobic glycolysis. Cell 2013; 153:1239–51. [DOI] [PMC free article] [PubMed] [Google Scholar]
- 24. Waters LR, Ahsan FM, Wolf DM, Shirihai O, Teitell MA. Initial B cell activation induces metabolic reprogramming and mitochondrial remodeling. iScience 2018; 5:99–109. [DOI] [PMC free article] [PubMed] [Google Scholar]
- 25. Balyan R, Gund R, Ebenezer C, Khalsa JK, Verghese DA, Krishnamurthy T et al Modulation of naive CD8 T cell response features by ligand density, affinity, and continued signaling via internalized TCRs. J Immunol. 2017; 198:1823–37. [DOI] [PubMed] [Google Scholar]
- 26. Hartman ML, Shirihai OS, Holbrook M, Xu G, Kocherla M, Shah A et al Relation of mitochondrial oxygen consumption in peripheral blood mononuclear cells to vascular function in type 2 diabetes mellitus. Vasc Med. 2014; 19:67–74. [DOI] [PMC free article] [PubMed] [Google Scholar]
- 27. Falcon S, Gentleman R. Hypergeometric testing used for gene set enrichment analysis. In: Bioconductor Case Studies [Internet]. New York, NY: Springer New York, 2008:207–20. [WWW document] URL http://link.springer.com/10.1007/978-0-387-77240-0_14 [accessed on 29 January 2018]. [Google Scholar]
- 28. Ingolia NT, Ghaemmaghami S, Newman JRS, Weissman JS. Genome‐wide analysis in vivo of translation with nucleotide resolution using ribosome profiling. Science (80‐) 2009; 324:218–23. [DOI] [PMC free article] [PubMed] [Google Scholar]
- 29. Langmead B, Salzberg SL. Fast gapped‐read alignment with Bowtie 2. Nat Methods 2012; 9:357–9. [DOI] [PMC free article] [PubMed] [Google Scholar]
- 30. Trapnell C, Pachter L, Salzberg SL. TopHat: discovering splice junctions with RNA‐Seq. Bioinformatics 2009; 25:1105–11. [DOI] [PMC free article] [PubMed] [Google Scholar]
- 31. Anders S, Pyl PT, Huber W. HTSeq–a Python framework to work with high‐throughput sequencing data. Bioinformatics 2015; 31:166–9. [DOI] [PMC free article] [PubMed] [Google Scholar]
- 32. Love MI, Huber W, Anders S. Moderated estimation of fold change and dispersion for RNA‐seq data with DESeq2. Genome Biol 2014; 15:550. [DOI] [PMC free article] [PubMed] [Google Scholar]
- 33. Subramanian A, Tamayo P, Mootha VK, Mukherjee S, Ebert BL, Gillette MA et al Gene set enrichment analysis: a knowledge‐based approach for interpreting genome‐wide expression profiles. Proc Natl Acad Sci USA 2005; 102:15 545–50. [DOI] [PMC free article] [PubMed] [Google Scholar]
- 34. Kucera M, Isserlin R, Arkhangorodsky A, Bader GD. AutoAnnotate: a Cytoscape app for summarizing networks with semantic annotations. F1000Research 2016; 5:1717. [DOI] [PMC free article] [PubMed] [Google Scholar]
- 35. Zhong Y, Karaletsos T, Drewe P, Sreedharan VT, Kuo D, Singh K et al RiboDiff: detecting changes of mRNA translation efficiency from ribosome footprints. Bioinformatics 2017; 33:139–41. [DOI] [PMC free article] [PubMed] [Google Scholar]
- 36. Painter MW, Davis S, Hardy RR, Mathis D, Benoist C. Transcriptomes of the B and T lineages compared by multiplatform microarray profiling. J Immunol 2011; 186:3047–57. [DOI] [PMC free article] [PubMed] [Google Scholar]
- 37. Kanehisa M, Goto S. KEGG: kyoto encyclopedia of genes and genomes. Nucleic Acids Res 2000; 28:27–30. [DOI] [PMC free article] [PubMed] [Google Scholar]
- 38. Ashburner M, Ball CA, Blake JA, Botstein D, Butler H, Cherry JM et al Gene ontology: tool for the unification of biology. Nat Genet 2000; 25:25–9. [DOI] [PMC free article] [PubMed] [Google Scholar]
- 39. Zhang S, Zhang X, Wang K, Xu X, Li M, Zhang J et al Newly generated CD4+ T cells acquire metabolic quiescence after thymic egress. J Immunol 2018; 200:1064–77. [DOI] [PubMed] [Google Scholar]
- 40. Buttgereit F, Brand MD. A hierarchy of ATP‐consuming processes in mammalian cells. Biochem J 1995; 312(Pt 1):163–7. [DOI] [PMC free article] [PubMed] [Google Scholar]
- 41. Dieterich DC, Hodas JJ, Gouzer G, Shadrin IY, Ngo JT, Triller A et al In situ visualization and dynamics of newly synthesized proteins in rat hippocampal neurons. Nat Neurosci. 2010; 13:897–905. [DOI] [PMC free article] [PubMed] [Google Scholar]
- 42. Bajénoff M, Egen JG, Koo LY, Laugier JP, Brau F, Glaichenhaus N et al Stromal cell networks regulate lymphocyte entry, migration, and territoriality in lymph nodes. Immunity 2006; 25:989–1001. [DOI] [PMC free article] [PubMed] [Google Scholar]
- 43. Worbs T, Mempel TR, Bölter J, von Andrian UH, Förster R. CCR40 ligands stimulate the intranodal motility of T lymphocytes in vivo . J Exp Med 2007; 204:489–95. [DOI] [PMC free article] [PubMed] [Google Scholar]
- 44. Germain RN, Robey EA, Cahalan MD. A decade of imaging cellular motility and interaction dynamics in the immune system. Science (80‐) 2012; 336:1676–81. [DOI] [PMC free article] [PubMed] [Google Scholar]
- 45. Qi H, Egen JG, Huang AYC, Germain RN. Extrafollicular activation of lymph node B cells by antigen‐bearing dendritic cells. Science (80‐) 2006; 312:1672–6. [DOI] [PubMed] [Google Scholar]
- 46. Roozendaal R, Mempel TR, Pitcher LA, Gonzalez SF, Verschoor A, Mebius RE et al Conduits mediate transport of low‐molecular‐weight antigen to lymph node follicles. Immunity 2009; 30:264–76. [DOI] [PMC free article] [PubMed] [Google Scholar]
- 47. DeLisle AJ, Graves RA, Marzluff WF, Johnson LF. Regulation of histone mRNA production and stability in serum‐stimulated mouse 3T6 fibroblasts. Mol Cell Biol 1983; 3:1920–9. [DOI] [PMC free article] [PubMed] [Google Scholar]
- 48. Jones RG, Pearce EJ. MenTORing immunity: mTOR signaling in the development and function of tissue‐resident immune cells. Immunity 2017; 46:730–42. [DOI] [PMC free article] [PubMed] [Google Scholar]
- 49. Merico D, Isserlin R, Stueker O, Emili A, Bader GD. Enrichment map: a network‐based method for gene‐set enrichment visualization and interpretation. PLoS ONE 2010; 5:e13984. [DOI] [PMC free article] [PubMed] [Google Scholar]
- 50. Prabhu SB, Khalsa JK, Banerjee H, Das A, Srivastava S, Mattoo HR et al Role of apoptosis‐inducing factor (Aif) in the T cell lineage. Indian J Med Res 2013; 138:577–90. [PMC free article] [PubMed] [Google Scholar]
- 51. Srivastava S, Banerjee H, Chaudhry A, Khare A, Sarin A, George A et al Apoptosis‐inducing factor regulates death in peripheral T cells. J Immunol 2007; 179:797–803. [DOI] [PubMed] [Google Scholar]
- 52. Vandenbon A, Dinh VH, Mikami N, Kitagawa Y, Teraguchi S, Ohkura N et al Immuno‐Navigator, a batch‐corrected coexpression database, reveals cell type‐specific gene networks in the immune system. Proc Natl Acad Sci USA 2016; 113:E2393–402. [DOI] [PMC free article] [PubMed] [Google Scholar]
- 53. Irizarry RA, Wang C, Zhou Y, Speed TP. Gene set enrichment analysis made simple. Stat Methods Med Res 2009; 18:565–75. [DOI] [PMC free article] [PubMed] [Google Scholar]
- 54. Caro‐Maldonado A, Wang R, Nichols AG, Kuraoka M, Milasta S, Sun LD et al Metabolic reprogramming is required for antibody production that is suppressed in anergic but exaggerated in chronically BAFF‐exposed B cells. J Immunol 2014; 192:3626–36. [DOI] [PMC free article] [PubMed] [Google Scholar]
- 55. Patke A, Mecklenbräuker I, Erdjument‐Bromage H, Tempst P, Tarakhovsky A. BAFF controls B cell metabolic fitness through a PKCβ‐ and Akt‐dependent mechanism. J Exp Med 2006; 203:2551–62. [DOI] [PMC free article] [PubMed] [Google Scholar]
- 56. Woodland RT, Fox CJ, Schmidt MR, Hammerman PS, Opferman JT, Korsmeyer SJ et al Multiple signaling pathways promote B lymphocyte stimulator dependent B‐cell growth and survival. Blood 2008; 111:750–60. [DOI] [PMC free article] [PubMed] [Google Scholar]
- 57. Hardy RR, Carmack CE, Shinton SA, Kemp JD, Hayakawa K. Resolution and characterization of pro‐B and pre‐pro‐B cell stages in normal mouse bone marrow. J Exp Med 1991; 173:1213–25. [DOI] [PMC free article] [PubMed] [Google Scholar]
- 58. Corcoran AE, Smart FM, Cowling RJ, Crompton T, Owen MJ, Venkitaraman AR. The interleukin‐7 receptor alpha chain transmits distinct signals for proliferation and differentiation during B lymphopoiesis. EMBO J 1996; 15:1924–32. [PMC free article] [PubMed] [Google Scholar]
- 59. Foster MP, Montecino‐Rodriguez E, Dorshkind K. Proliferation of bone marrow pro‐B cells is dependent on stimulation by the pituitary/thyroid axis. J Immunol 1999; 163:5883–90. [PubMed] [Google Scholar]
- 60. Osmond DG. The turnover of B‐cell populations. Immunol Today 1993; 14:34–7. [DOI] [PubMed] [Google Scholar]
- 61. Scott AJ, Wilkinson AS, Wilkinson JC. Basal metabolic state governs AIF‐dependent growth support in pancreatic cancer cells. BMC Cancer 2016; 16:286. [DOI] [PMC free article] [PubMed] [Google Scholar]
- 62. Joza N, Oudit GY, Brown D, Bénit P, Kassiri Z, Vahsen N et al Muscle‐specific loss of apoptosis‐inducing factor leads to mitochondrial dysfunction, skeletal muscle atrophy, and dilated cardiomyopathy. Mol Cell Biol 2005; 25:10 261–72. [DOI] [PMC free article] [PubMed] [Google Scholar]
- 63. Lakey EK, Casten LA, Niebling WL, Margoliash E, Pierce SK. Time dependence of B cell processing and presentation of peptide and native protein antigens. J Immunol 1988; 140:3309–14. [PubMed] [Google Scholar]
- 64. Eisenlohr LC, Gerhard W, Hackett CJ. Individual class II‐restricted antigenic determinants of the same protein exhibit distinct kinetics of appearance and persistence on antigen‐presenting cells. J Immunol 1988; 141:2581–4. [PubMed] [Google Scholar]
- 65. Gosselin EJ, Tony HP, Parker DC. Characterization of antigen processing and presentation by resting B lymphocytes. J Immunol 1988; 140:1408–13. [PubMed] [Google Scholar]
- 66. van Anken E, Romijn EP, Maggioni C, Mezghrani A, Sitia R, Braakman I et al Sequential waves of functionally related proteins are expressed when B cells prepare for antibody secretion. Immunity 2003; 18:243–53. [DOI] [PubMed] [Google Scholar]
- 67. Ziegler K, Unanue ER. Identification of a macrophage antigen‐processing event required for I‐region‐restricted antigen presentation to T lymphocytes. J Immunol 1981; 127:1869–75. [PubMed] [Google Scholar]
- 68. Graczyk D, White RJ, Ryan KM. Involvement of RNA polymerase III in immune responses. Mol Cell Biol 2015; 35:1848–59. [DOI] [PMC free article] [PubMed] [Google Scholar]
- 69. Lelouard H, Schmidt EK, Camosseto V, Clavarino G, Ceppi M, Hsu H‐T et al Regulation of translation is required for dendritic cell function and survival during activation. J Cell Biol 2007; 179:1427–39. [DOI] [PMC free article] [PubMed] [Google Scholar]
- 70. Krummel MF, Bartumeus F, Gérard A. T cell migration, search strategies and mechanisms. Nat Rev Immunol 2016; 16:193–201. [DOI] [PMC free article] [PubMed] [Google Scholar]
- 71. Haas R, Smith J, Rocher‐Ros V, Nadkarni S, Montero‐Melendez T, D'Acquisto F et al Lactate regulates metabolic and pro‐inflammatory circuits in control of T cell migration and effector functions. PLoS Biol 2015; 13:e1002202. [DOI] [PMC free article] [PubMed] [Google Scholar]
- 72. Blattman JN, Antia R, Sourdive DJD, Wang X, Kaech SM, Murali‐Krishna K et al Estimating the precursor frequency of naive antigen‐specific CD8 T cells. J Exp Med 2002; 195:657–64. [DOI] [PMC free article] [PubMed] [Google Scholar]
- 73. Shiraishi T, Verdone JE, Huang J, Kahlert UD, Hernandez JR, Torga G et al Glycolysis is the primary bioenergetic pathway for cell motility and cytoskeletal remodeling in human prostate and breast cancer cells. Oncotarget 2015; 6:130–43. [DOI] [PMC free article] [PubMed] [Google Scholar]
- 74. Goodwin ML, Gladden LB, Nijsten MWN, Jones KB. Lactate and cancer: revisiting the Warburg effect in an era of lactate shuttling. Front Nutr 2015; 1:27. [DOI] [PMC free article] [PubMed] [Google Scholar]
- 75. Mosely SIS, Prime JE, Sainson RCA, Koopmann J‐O, Wang DYQ, Greenawalt DM et al Rational selection of syngeneic preclinical tumor models for immunotherapeutic drug discovery. Cancer Immunol Res 2017; 5:29–41. [DOI] [PubMed] [Google Scholar]
Associated Data
This section collects any data citations, data availability statements, or supplementary materials included in this article.
Supplementary Materials
Figure S1. Pathway enrichment of differentially expressed genes, plotted as enrichment score (details of calculation in methods) versus negative log P‐value.
Figure S2. Heatmap showing differential expression of genes from enriched pathways (from Fig. S1) in B‐ and T‐cells.
Figure S3. Gating strategy for B‐ and T‐cell subsets in thymus, bone marrow and spleen.
Figure S4. Box plots (a) and clustering (b) of Immgen subsets based on microarray data.
Figure S5. Contribution of PC3 in separating immature and mature B‐ and T‐cell subsets.
Figure S6. Heatmap of gene expression in all T‐ and B‐subsets based on genes that contributed to all three principal components.
Figure S7. RNAseq data (this study) and public microarray data (from Immgen database) for resting B‐ and T cells‐correlate.
Table S1 List of genes differentially expressed between splenic follicular B‐cells and splenic naive T‐cells.
Table S2 List of KEGG pathways related to this study.
Table S3 List of genes associated with pathways listed in Table S2.
Table S4 Enrichment score of the differentially expressed genes for the KEGG pathways in Table S2.
Table S5 List of microarray data sets downloaded from the immunological genome project for developmental stage comparison.
Table S6 PCA analysis results shown in Fig. 3.
Table S7 Results of the pairwise analysis of developmental stage‐specific gene expression.
Table S8 Enrichment scores for gene sets between developmental stages.
Table S9 Ribosome profiling differential expression results.
Table S10 TEs calculated by Ribodiff package.