
Figure 2.
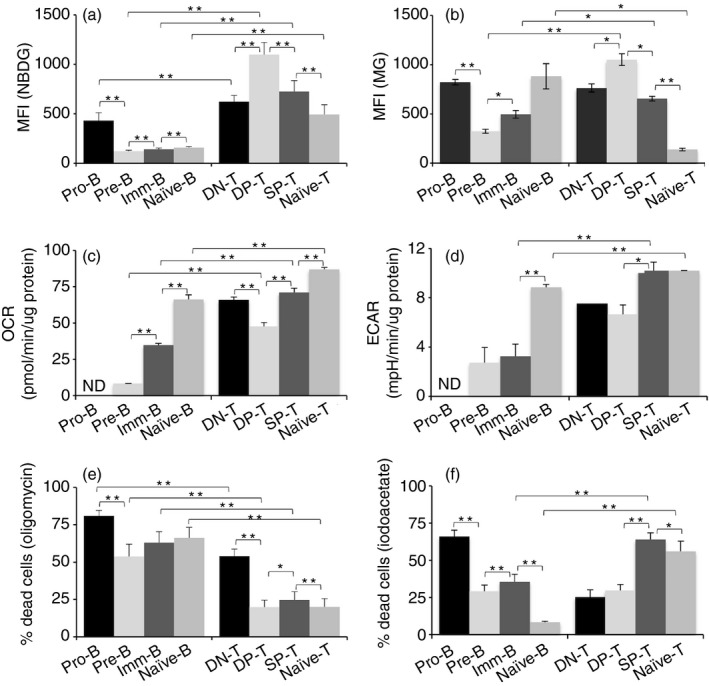
Differences in energy metabolism are established early during B and T lineage differentiation. (a) Ex vivo spleen, thymus and bone‐marrow cells were cultured in the presence of NBDG for 30 min and counterstained for cell‐surface markers to define subsets. (b) Spleen, thymus and bone‐marrow cells were stained with Mitotracker green (MG) and counterstained for cell‐surface markers. Data represent mean ± SE. n = 9 mice/group. (c and d) Different developmental stages were sorted from spleen, thymus and bone‐marrow, and oxygen consumption rate (OCR) (c) and extracellular acidification rate (ECAR) (d) were analysed. ND: not determined due to insufficient cell numbers. (e and f) Cell death in the presence of oligomycin (e) and iodoacetate (f) are shown. *P < 0·05, **P < 0·01.