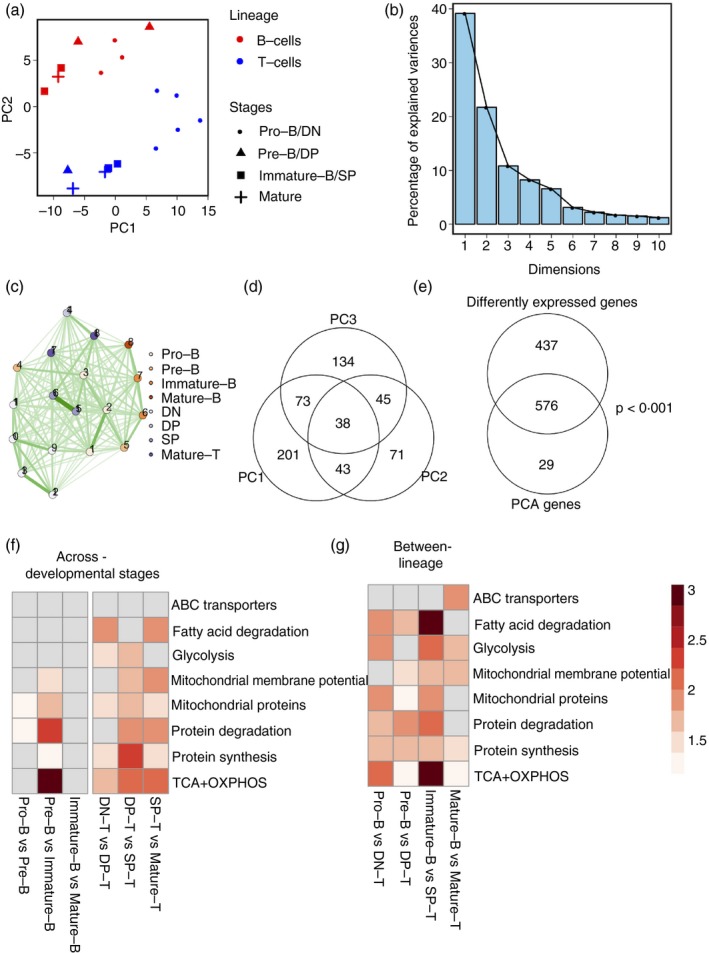
Figure 3.

B and T lineage cells have divergent expression patterns of metabolic pathway genes. (a) Principal component analysis (PCA) of B and T development subsets according to gene expression in metabolism‐associated genes. PC1 versus PC2 plots showing clustering and separation of the two lineages and developmental stages when metabolism‐associated gene expression levels are considered. (b) Scree plots of (a) showing the percentage of variances explained by each PC. (c) Network map showing Euclidean distances between each cell subset based on expression of metabolism‐associated genes. Nodes represent cell subsets as indicated. Edges indicate the strength of connection, with darker lines indicating closer distances than lighter lines. (d) Overlap in genes that contribute to PC1, PC2 and PC3 indicated by the Venn diagram. (e) Significant overlap in genes differentially expressed between any two cell subsets and genes contributing to the first three PCs. (f) Heatmap showing enrichment scores of each metabolic pathway (rows) for inter‐lineage cell subset pairs (columns). Higher intensity of colour indicates higher enrichment scores. White cells represent no significant enrichment. (g) Heatmap showing enrichment scores of each metabolic pathway (rows) for each developmental transition in B‐cell and T‐cell lineage (columns). Higher intensity of colour indicates higher enrichment scores. White cells represent no significant enrichment.
