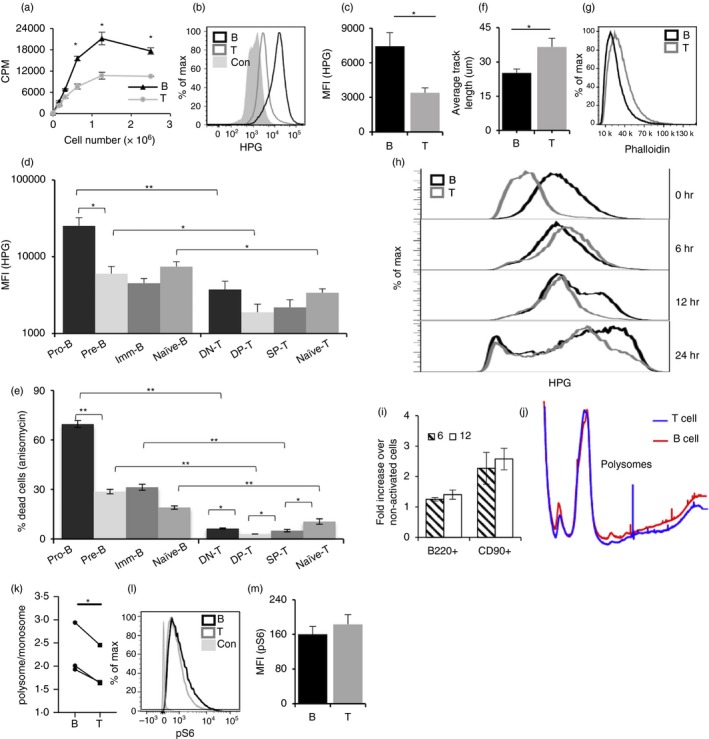
Figure 4.

B‐cells exhibit higher protein synthesis, while T‐cells exhibit higher cell motility. (a) Quantitation of uptake of tritiated leucine by B‐ and T‐cells. (b) Representative flow cytometry plot for l‐homopropargylglycine (HPG) uptake by B‐ and T‐cells. (c) MFI for HPG uptake from (b) quantified and data represented as mean ± SE from nine mice. (d) HPG uptake by developmental intermediates of B‐ and T‐cells. (e) Sensitivity of B‐ and T‐cell intermediates to anisomycin. (f) Motility of sorted B‐ and T‐cells on cultured bone‐marrow‐derived dendritic cells (BMDCs). Data represent average track length ± SE traversed by B‐ and T‐cells in 1 hr in 35–40 individual cells. (g) Actin levels in B‐ and T‐cells measured by Phalloidin. B220+ (black line) and CD90+ (grey line). (h) HPG incorporation of B‐ and T‐cells without activation, upon activation for 6, 12 and 24 hr. (i) MFI from (h) plotted from three individual mice. MFI represented as mean ± SE from 3 mice; 6 hr (filled) and 12 hr (open) histograms. (j) Polysome profile comparison of B‐ and T‐cells. Red traces show B‐cell polysome profile, and blue traces show T‐cell profile. The profiles were normalized for monosome peak height (80 S). (k) Polysome : monosome ratios are shown for B‐ and T‐cells. The data represent three independent experiments and are shown as mean ± SEM (*P < 0·05 in a two‐tailed paired ‘t’‐test). (l) MFI for pS6 expression from (k) quantified and data represented as mean ± SE from nine mice. *P < 0·05, **P < 0·01.
