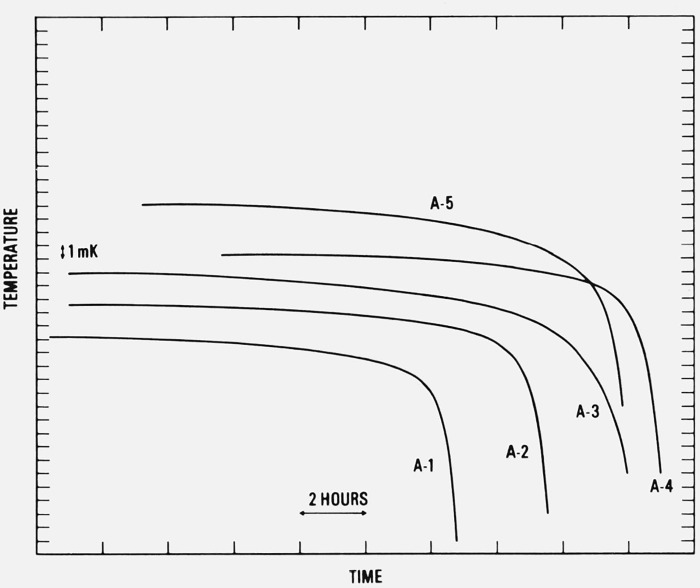
Figure 8.
Typical freezing curves of the aluminum samples recorded starting approximately fifteen minutes after the insertion of the platinum resistance thermometer in the cell.
The curves are displaced both vertically and horizontally; they are meant to show only the relative temperatures within the individual freezing curves.

