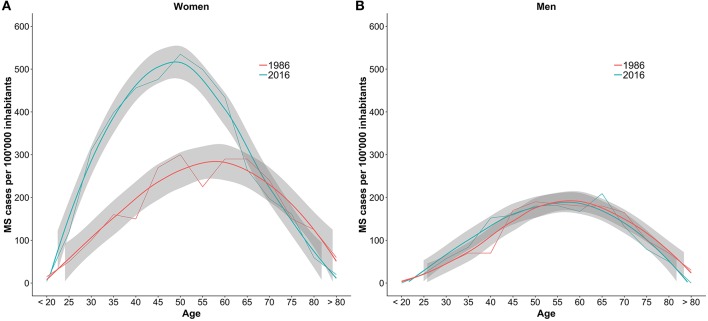
Figure 3.
Comparison of the number of MS cases per 100,000 inhabitants per age group between 1986 and 2016. The numbers are stratified by sex with women in plot (A) and men in plot (B). The gray bands are the result of smoother functions being applied to the data and do not represent confidence intervals of the estimates.

