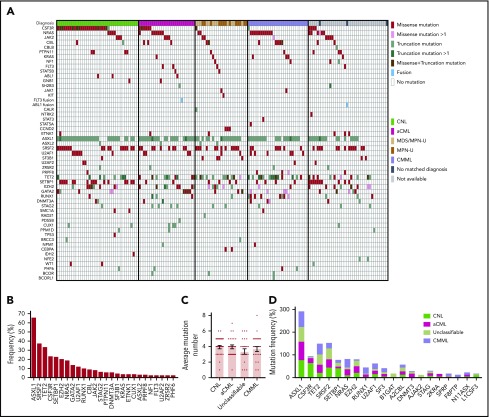
Figure 1.
Genomic landscape of CNL/aCML/unclassifiable/CMML. (A) The mosaic plot depicts distributions of recurrent gene mutations in 158 patients. Each column displays each patient, and each row denotes a specific gene. Variant types are color coded as indicated. (B) The graph depicts frequencies of recurrent gene mutations in this cohort of CNL/aCML/unclassifiable/CMML patients. (C) The graph depicts the mean ± SEM of the number of mutations in different diagnostic groups. Statistical analysis was performed using a 1-way ANOVA. (D) The graph depicts the frequencies of recurrently mutated genes in different diagnostic groups. Statistical analysis was performed using a contingency table χ2 test followed by the Bonferroni correction and expressed as P < .0001.

