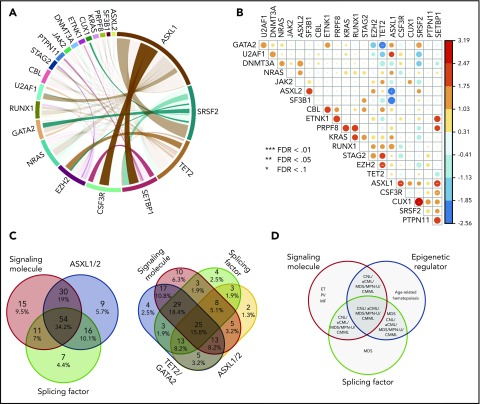
Figure 2.
Mutations in signaling molecules, epigenetic regulators, and splicing factors are frequently co-occurring in CNL/aCML/unclassifiable/CMML. (A) The circos plot depicts the relative frequency and pairwise co-occurrence of molecular mutations. Outer segments indicate a particular subcohort being positive for the given gene mutations. Relative frequencies of pairwise co-occurrences are indicated by ribbon widths. The transparency of the lines is tied to their significance in panel B (no transparency indicates the co-occurrence is significant). (B) Exclusivity and co-occurrence between different gene mutations. The circles were sized and colored according to their log(odds) from a Fisher’s exact test (red color series represent co-occurrence and blue series represent exclusivity). (C) Venn diagrams depict distribution and co-occurrence frequencies of mutations of ASXL1/2, signaling molecules, and splicing factors (left panel) or mutations of ASXL1, signaling molecules, splicing factors, and TET2/GATA2 mutations (right panel). (D) Venn diagram showing potential association and distribution of different pathway mutations with different disease diagnosis. ET, essential thrombocythemia; MF, myelofibrosis; PV, polycythemia vera.

