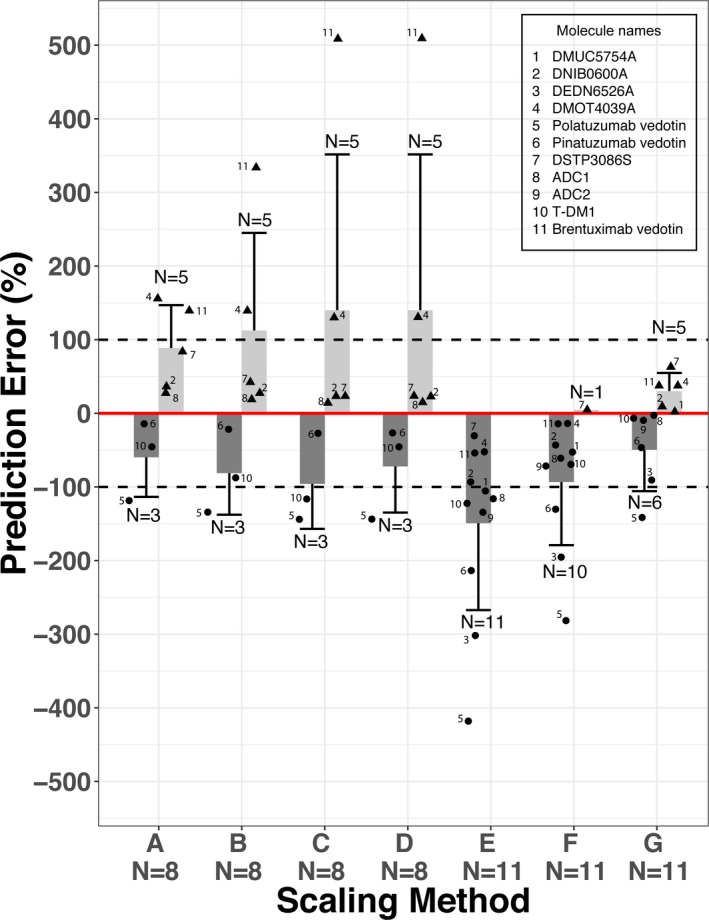
Figure 1.

Accuracy of allometric scaling of human clearance (CL) of total antibody analytes for 11 antibody–drug conjugates (ADCs) from observed clearance using various scaling methods. (A) Multiple species allometric scaling, (B) allometric scaling with maximum life potential as correction factor, (C) allometric scaling with brain weight as correction factor, (D) allometric scaling based on rule of exponent, (E) scaling from cynomolgus monkey using a fixed exponent of clearance of 0.75, (F) scaling from cynomolgus monkey using a fixed exponent of clearance (CL) of 0.85, and (G) scaling from cynomolgus monkey using a fixed exponent of CL of 1.0. No rodent pharmacokinetic data are available for DMUC5754A, DEDN6526A, and ADC2, therefore, allometric scaling from cynomolgus monkey alone were performed for these three ADCs. Percentage prediction errors (PEs) is calculated as ((CLhuman, predicted − CLhuman, observed)/CLhuman, observed) × 100% for overprediction ( ) and ((CLhuman, predicted − CLhuman, observed)/CLhuman, predicted) × 100% for underprediction (
 ), respectively. The solid red line represents %PE = 0. The dashed lines represent %PE = 100% or −100% (i.e., twofold difference on CL). Light grey bar (
 ) and whisker: mean + SD of PE for ADCs with positive PE (i.e., overprediction of human CL); dark grey bar (
 ) and whisker: mean − SD of PE for ADCs with negative PE (i.e., underprediction of human CL); N above or below the whisker is number of ADCs with positive PE or negative PE; solid triangle (▲) represents individual PE for ADCs with positive PE (i.e., overprediction of human CL); solid dot (●) represents individual PE for ADCs with negative PE (i.e., underprediction of human CL).
