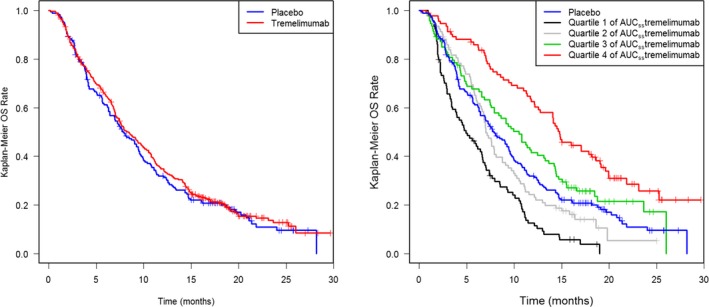
Figure 1.

Left panel: Kaplan–Meier analysis of overall survival (OS) by treatment group (intention‐to‐treat population). Right panel: Kaplan–Meier analysis of OS by quartiles of exposure at area under the exposure time‐course curve at steady‐state (AUC ss) for the tremelimumab‐treated group with overlaid placebo group OS profile.
