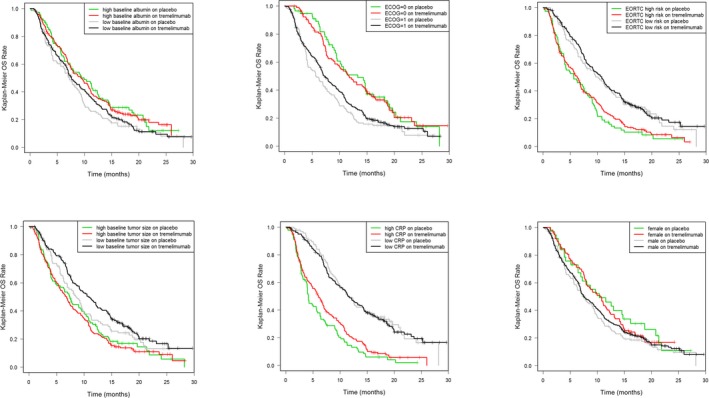
Figure 2.

Kaplan–Meier analyses of overall survival (OS) split by baseline patient factors in each treatment arm. Kaplan–Meier plots of the key factors indicating differentiation in OS are presented for reference. All other Kaplan–Meier plots showed little difference (data on file). CRP, C‐reactive protein; ECOG, Eastern Cooperative Oncology Group ; EORTC, European Organisation for Research and Treatment of Cancer.
