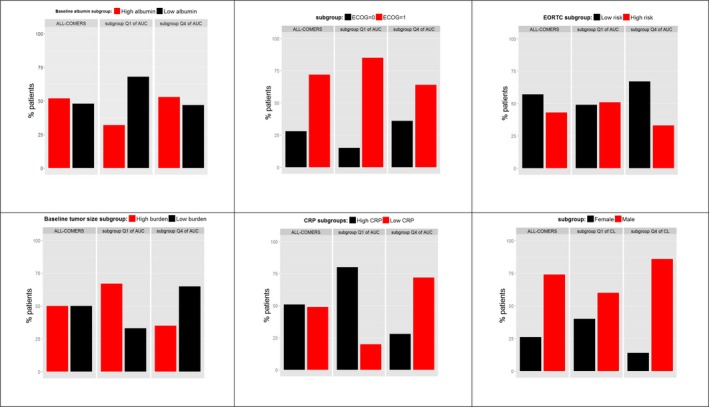
Figure 3.

Proportion of patients with each baseline risk factor indicating differentiation in overall survival in the overall population (all‐comers) and in each extreme exposure quartile of area under the exposure time‐course curve at steady‐state (AUC ss) or clearance (CL; Q1 and Q4). Continuous covariates (serum albumin, C‐reactive protein (CRP), and tumor burden) were dichotomized into high and low levels based on their respective median cutoff. Tremelimumab predicted exposure at steady‐state (AUC ss) was used for all comparison apart for SEX for which CL was used instead to prevent body weight confounding due to the tremelimumab weight‐based dosing scheme (AUC ss = dose/CL). Q1, lowest quartile; Q4, highest quartile. ECOG, Eastern Cooperative Oncology Group; EORTC, European Organisation for Research and Treatment of Cancer.
