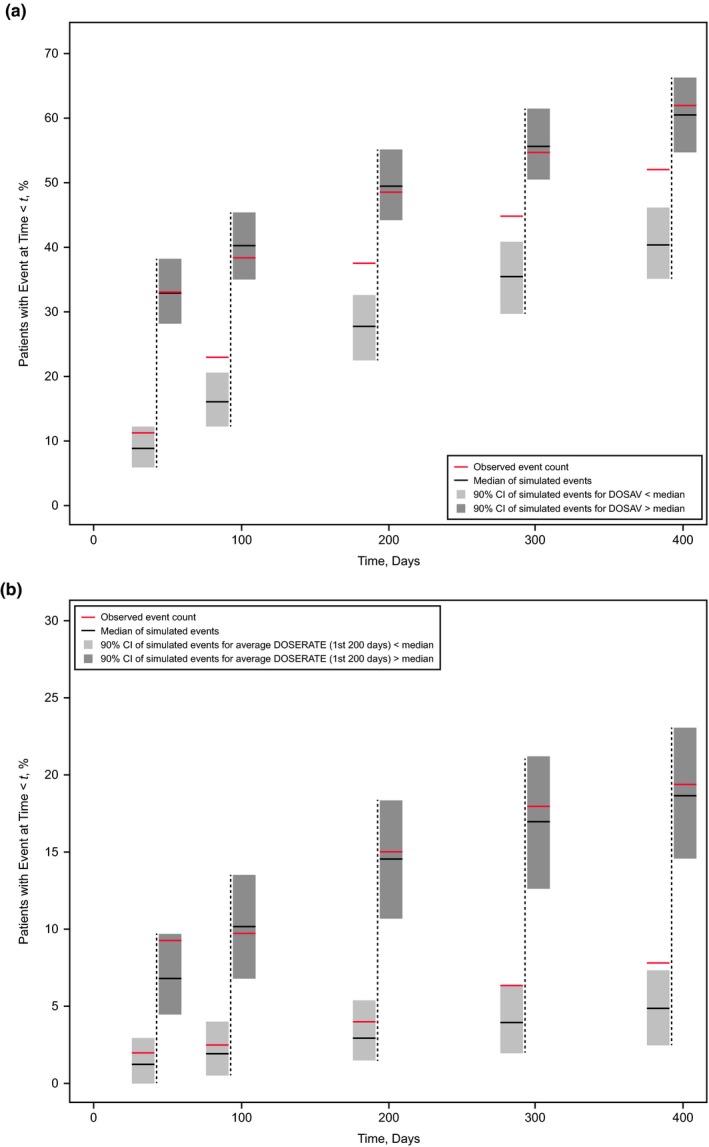
Figure 4.

Qualification of the (a) Constant + Gompertz hazard model for adverse events (AEs) grade ≥ 3 and (b) Weibull hazard model for grade ≥ 2 diarrhea stratified by prediction‐corrected visual predictive check (pc‐VPC). The pc‐VPC shows 5 prediction bins at 50, 100, 200, 300, and 400 days (vertical dashed lines) after start of sorafenib treatment. For each time bin, light gray and dark gray fields represent the 90% prediction interval of the 1,000 simulated event rates for AEs in patients with average dose below and above the population median, respectively. Black horizontal bars indicate the respective simulated medians, and red horizontal bars show the observed rates of (a) grade ≥ 3 AEs and (b) grade ≥ 2 diarrhea events in the 2 strata. Event rates are calculated cumulatively up to the time of the bin. Each of the 1,000 simulated trials used all 413 patients, of whom 207 initially received placebo; 155 of these 207 patients (75%) were crossed over to sorafenib after disease progression. DOSAV, distribution of the average sorafenib dose.
