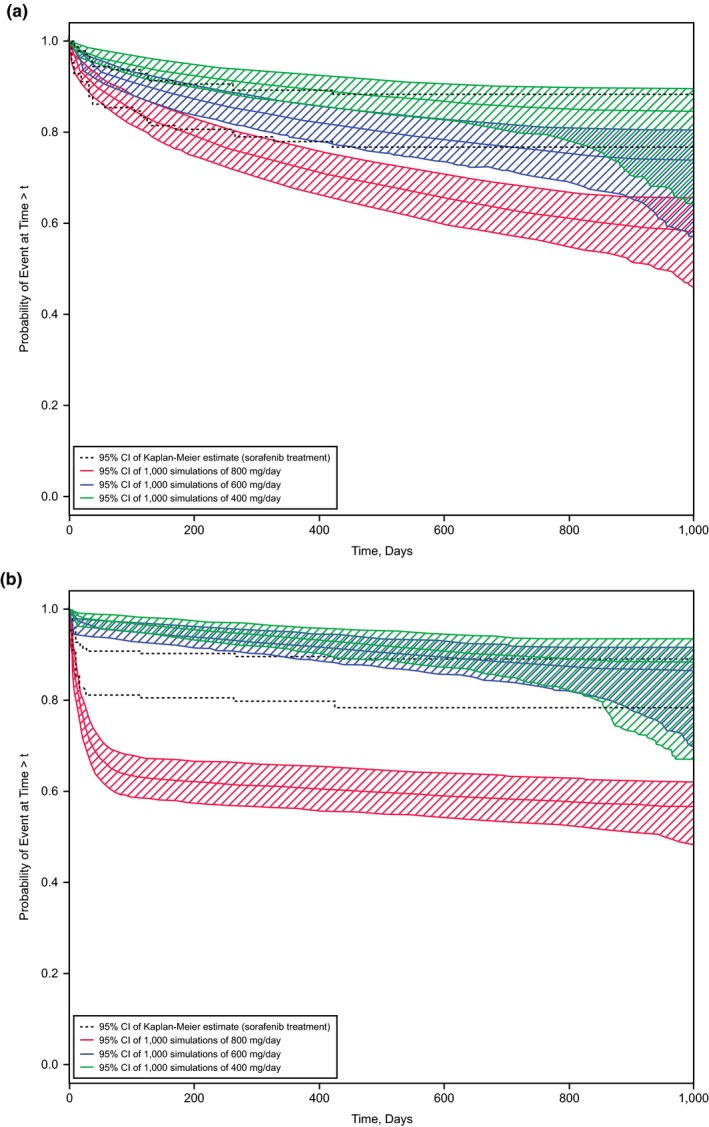
Figure 5.

Observed and simulated risk of adverse events. Kaplan−Meier plots of the observed risk are shown by 95% confidence intervals (CIs; dashed lines). The colored bands represent the 95% CIs of simulated Kaplan−Meier plots for the doses described in the keys. (a) Grade ≥ 2 diarrhea. (b) Grade 3 hand‐foot skin reactions.
