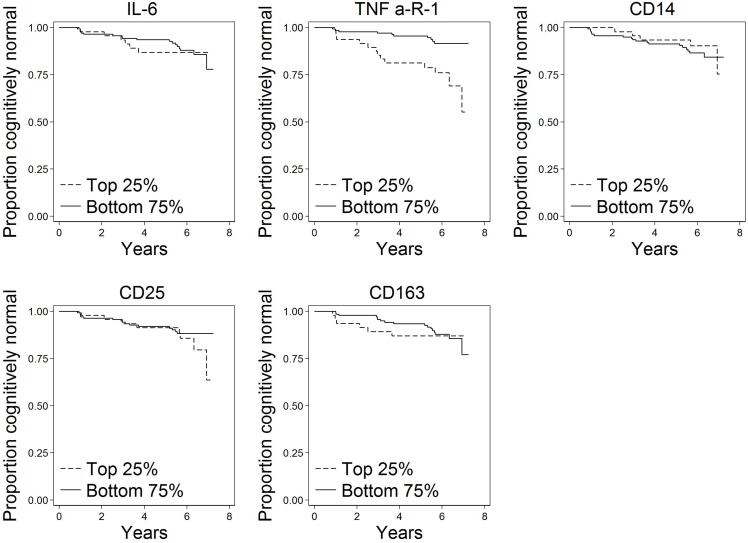
FIGURE 2.
Kaplan–Meier plots of time to onset of MCI by top quartile of each biomarker (N = 191). These plots show time to progression from normal cognition to onset of MCI by biomarker level. A progressor is a participant who was cognitively normal at baseline and developed clinical symptoms of MCI during follow-up as determined by a standardized clinical adjudication procedure (described in the section “Materials and Methods” and Supplementary Appendix e-1).

