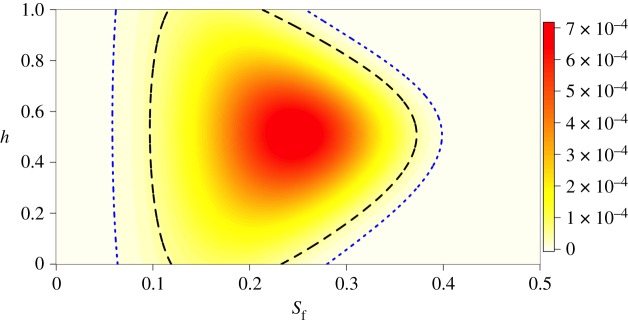
Figure 4.
The posterior probability density of the strength of selection against drive in females (sf) and the dominance coefficient (h). Colour indicates probability density, with darker colours indicating higher likelihood. The black dashed contour shows the 95% credible interval and the blue dotted line shows the 99% credible interval. (Online version in colour.)

