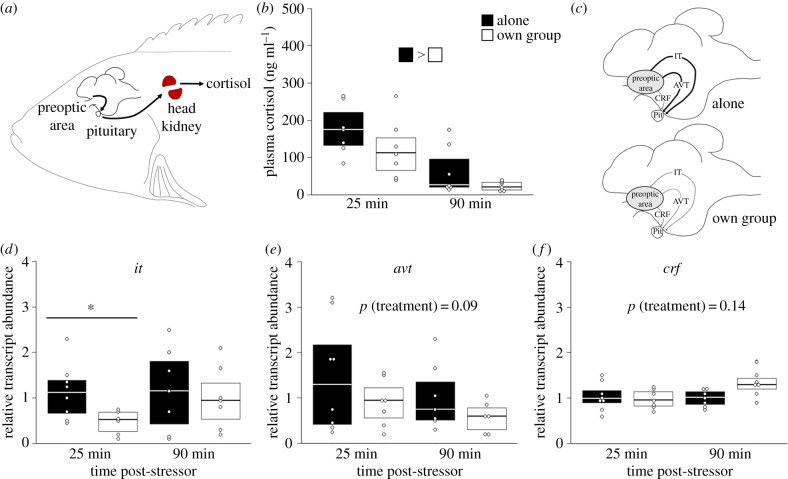
Figure 3.
Visual representation of the endocrine stress axis (hypothalamic–pituitary–interrenal axis) in N. pulcher (a), and changes in neuroendocrine regulation of the stress axis in the brains of individuals that recovered alone or with their own social group, where darker lines indicate increased activation (c). Circulating plasma cortisol levels (b); and relative transcript abundance of it (d), avt (e) and crf (f) in the preoptic area of individuals that either recovered alone or with their own social group (experiment 1). Values are presented as medians and 1st and 3rd quartiles; points represent individual values. Differences between groups are indicated using the bar fills or by an asterisk (see text for further details). AVT, arginine vasotocin; CRF, corticotropin-releasing factor; IT, isotocin; Pit, pituitary.

