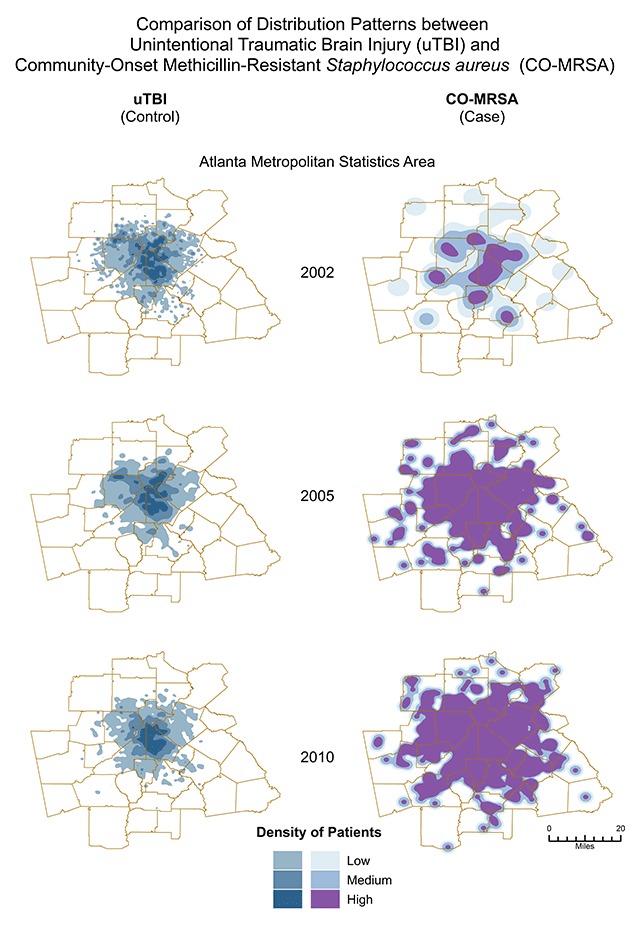
Figure 1.

Spatially different patterns of distribution between uTBI (control) and CO-MRSA (cases.) uTBI shows a “static” pattern without much variation over the 9 years. In contrast, CO-MRSA displays patterns of spatial diffusion spread. Although spatial maps were conducted for each year, only maps reflecting spatial patterns for 2002, 2005 and 2010 are shown above.
