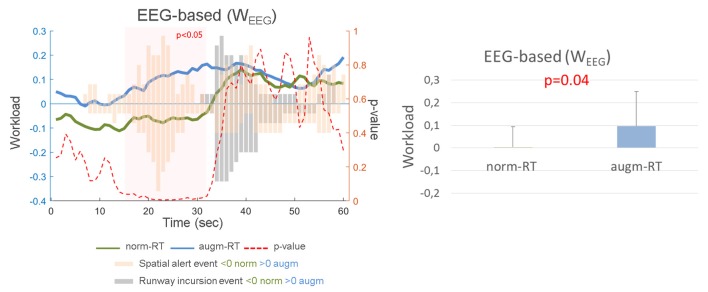
Figure 10.
WEEG score exhibited a significant increase in the experienced workload during the augm-RT condition with respect to the norm-RT one, which is consistent with the results provided by the SME workload assessment. On the left side it was reported a grand average of the WEEG index over all the subjects, for each experimental scenario. We reported the events distribution for all the subjects, for the whole time duration (orange Spatial Alert events, and gray Runway incursion ones). Bars higher than 0 are referred to augm-RT scenario events, while bars lower than 0 are referred to norm-RT scenario events. It has also been reported in red the point by point p-value, highlighting that the significance was reached (i.e., red transparent rectangle) just around the appearance of the spatial sound events. On the contrary, during the appearance of Runway incursion events (i.e., gray bars), the workload increased in both the scenarios, in fact statistics did not show any significant trend. On the right it has been reported the mean and standard deviation of WEEG index related to the two scenarios.

