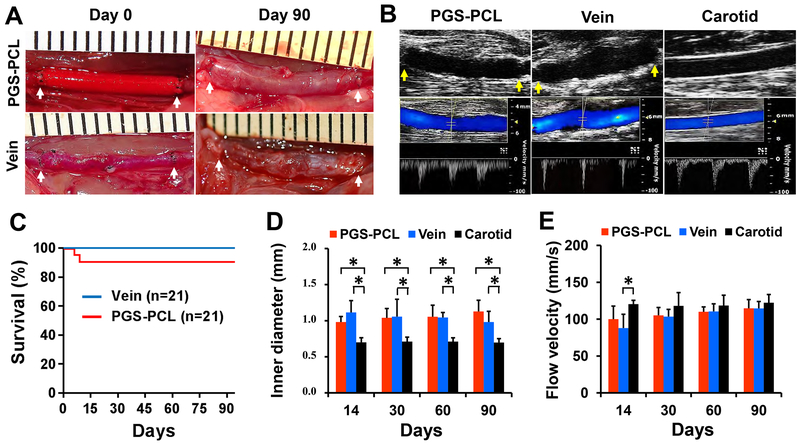
Fig.1. Graft implantation and patency.
(A) Gross appearance of the grafts at day 0 and 90 post-implantation. Arrows indicate suture lines. PGS-PCL, synthetic graft. Vein, vein graft. (B) Representative ultrasound images of grafts and native artery at day 90. B-mode (top row), color Doppler and pulse wave (PW) modes (bottom row). Arrows indicate suture lines. Carotid, native common carotid artery. (C) Survival plot showing the overall patency of the grafts. There is no statistical difference between two grafts (P = 0.15). (D) The inner diameter measured by B-mode images. (E) Flow velocity measured in the middle region of the grafts and native carotids by PW mode images. Data in (D) and (E) are means ± standard deviation (SD) (n = 5). * represents P < 0.05.

