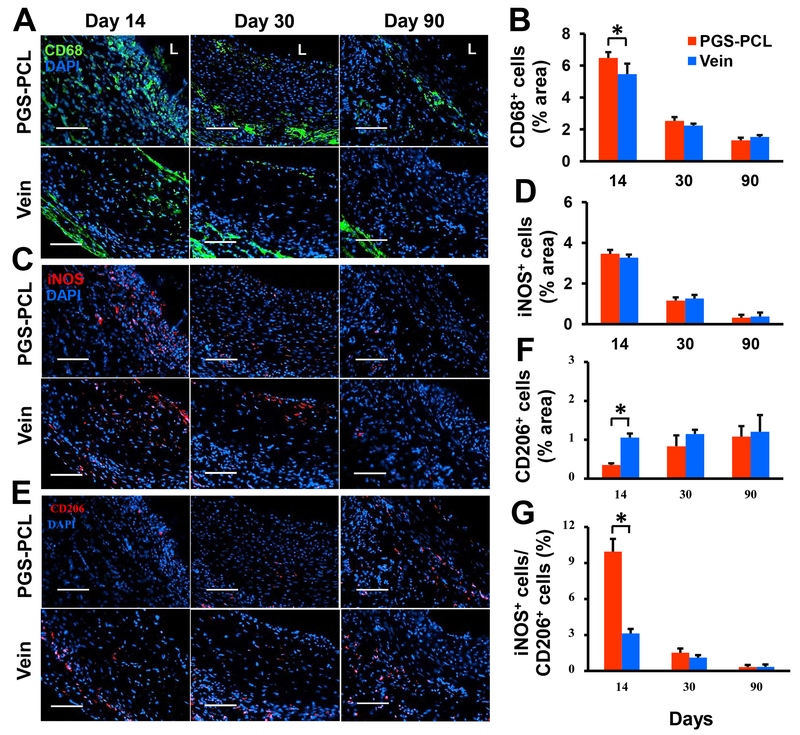
Fig.5. Macrophage infiltration and polarization.
(A) Representative images for immunofluorescence staining with the pan-macrophage marker CD68. L, lumen. (B) Quantification of the results shown in (A). (C) Representative images for immunofluorescence staining with the Ml macrophage marker iNOS. (D) Quantification of the results shown in (C). (E) Representative images for immunofluorescence staining with the M2 macrophage marker CD206. (F) Quantification of the results shown in (E). (G) The area ratio of iNOS+ to CD206+ cells representing the M1/M2 macrophage ratio. Scale bars, 100 μm (A, C, and E). Data in (B), (D), (F) and (G) are means ± SD (n = 4). * represents P < 0.05.

