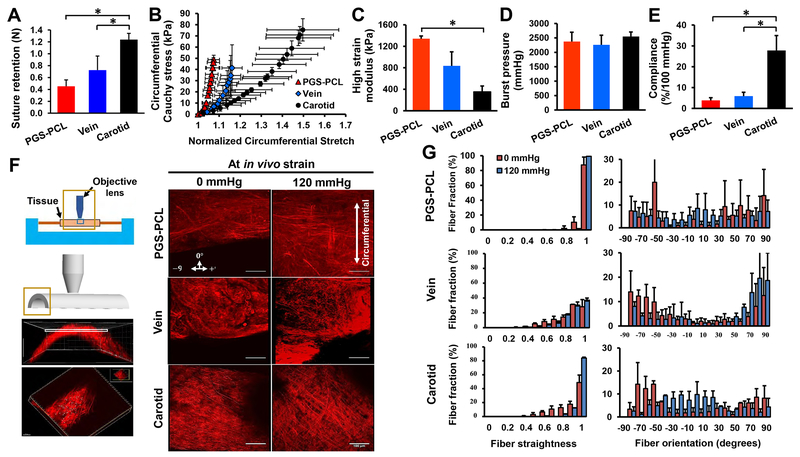
Fig.8. Assessment of mechanical response.
(A) Suture retention strength of bare grafts and native vessels before implantation. (B) Circumferential stress-stretch curves. (C) High strain moduli. (D) Burst pressure. (E) Compliance. (F) Schematic of biaxial inflation device used with a multiphoton microscope to image collagen fibers (left). Planar images were obtained starting from the outer wall, moving down to the inner wall with images stacked to obtain projection images of collagen fibers across the thickness of the sample. Scale bars, 100 μm. Note the difference in collagen fiber density, morphology and orientation between samples (right). (G) Collagen fiber straightness and orientation quantified in each slice across sample thickness and normalized to a total number of traced fibers. A value of 1 represents completely straightened (recruited) fibers. Orientation was measured from θ = 0° to 90° with θ = 0° being the circumferential direction. Data in (A) - (E) are means ± SD (n = 5 for A and n = 3 for B - E). Data in (B)-(G) were obtained from explanted grafts and native carotids at day 90. * represents P < 0.05.

