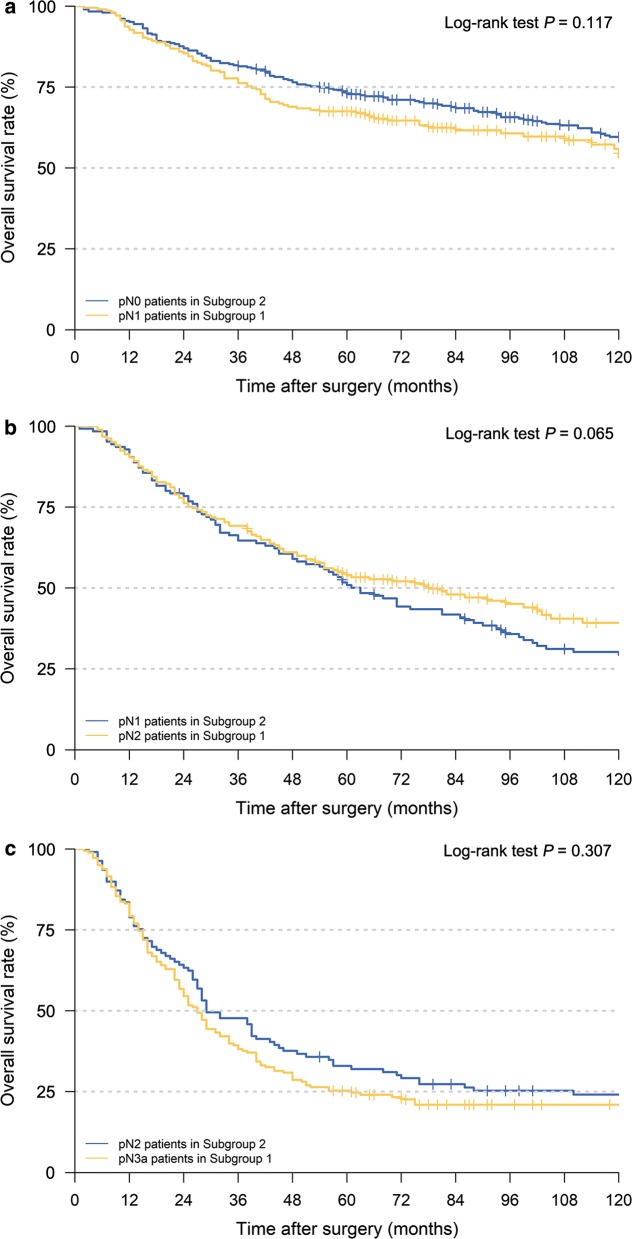
Fig. 5.
Kaplan–Meier OS curves of patients under different pN stages assigned to different subgroups. a pN0 patients in Subgroup 2 vs. pN1 patients in Subgroup 1, b pN1 patients in Subgroup 2 vs. pN2 patients in Subgroup 1, c pN2 patients in Subgroup 2 vs. pN3a patients in Subgroup 1. (Subgroup 1: patients with retrieval of Group 1 LNs > 13 or Group 2 LNs > 9; Subgroup 2: patients with retrieval of Group 1 LNs ≤ 13 and Group 2 LNs ≤ 9). OS overall survival, pN pathological lymph node classification

