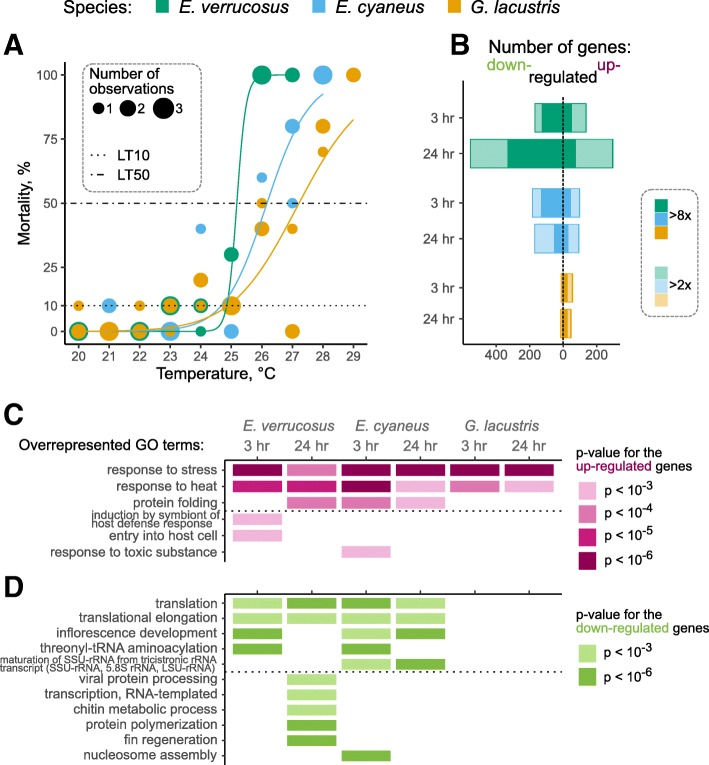
Fig. 3.
Temperature sensitivities of the different amphipod species and their transcriptional responses to elevated temperature. a, % mortalities of the studied species at different temperatures. The point size is proportional to the number of data points for the same species located at the same coordinates; this solution was chosen to avoid overplotting. b, numbers of up- and down-regulated genes in each species after 3-h and 24-h exposures to the species-specific LT10. The full list of DE genes and the corresponding fold change and p-values are available from Additional file 3. c, GO terms enriched in the transcripts up-regulated under acute heat shock. d, GO terms enriched for the transcripts down-regulated under these conditions. Only GO terms enriched with a p-value of at most 0.001 and including at least two differentially expressed transcripts are shown

