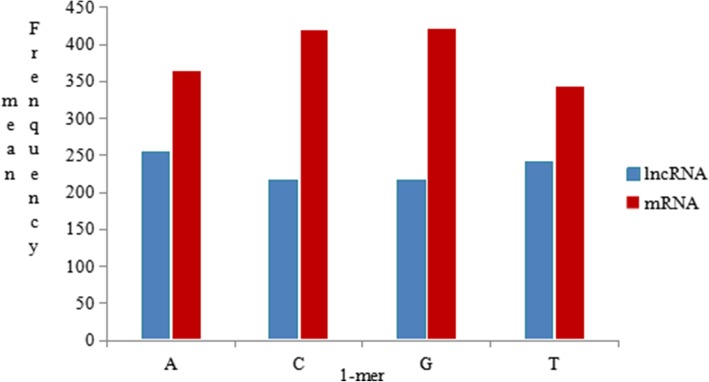
Fig. 4.
The 1-mer frequency distribution histogram. The contents of the A, C, G, and T bases in the lncRNA sequence are approximately 254 nt, 217 nt, 216 nt, and 240 nt, respectively, while the mRNA sequence has A, C, G, and T base contents of approximately 364 nt, 420 nt, 422 nt, and 343 nt, respectively, when we randomly select 5000 lncRNA sequence data and 5000 mRNA sequence data

