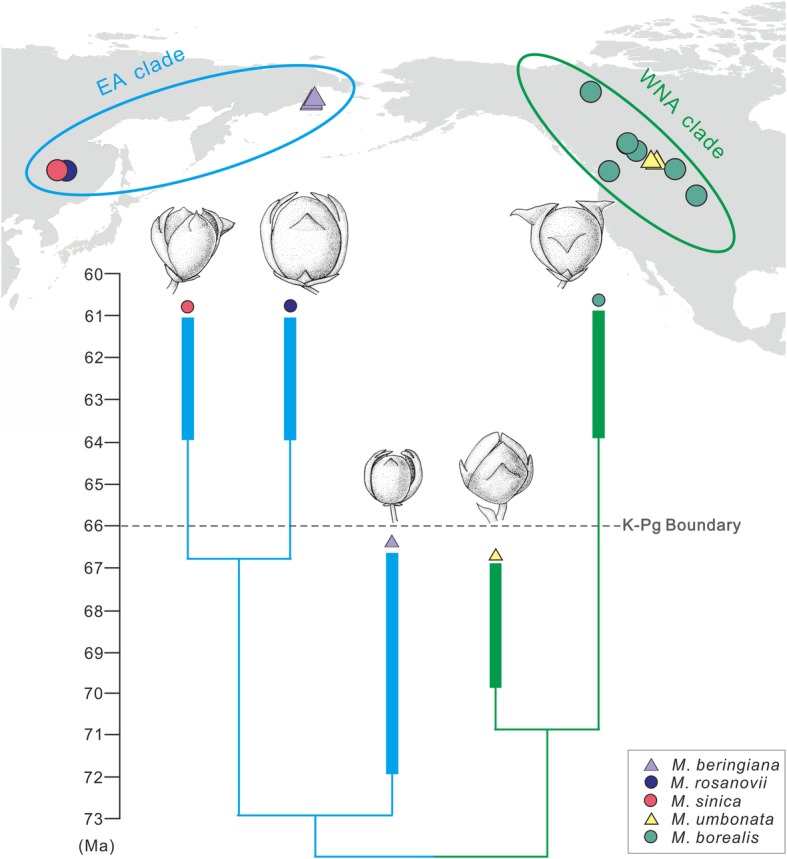
Fig. 5.

Time-scaled phylogeny, distribution and seed cone’s morphological changes of Mesocyparis. This figure shows obvious morphological changes of Mesocyparis in ca. Ten million years during the K-Pg transition. The cladogram is simplified from the strict consensus tree obtained from the phylogenetic analysis. The bars represent the dating of upper and lower limits of terminal taxon-bearing deposits, and a minimum branch length of 1 Ma based on the “minimum branch length” method used in [53]
