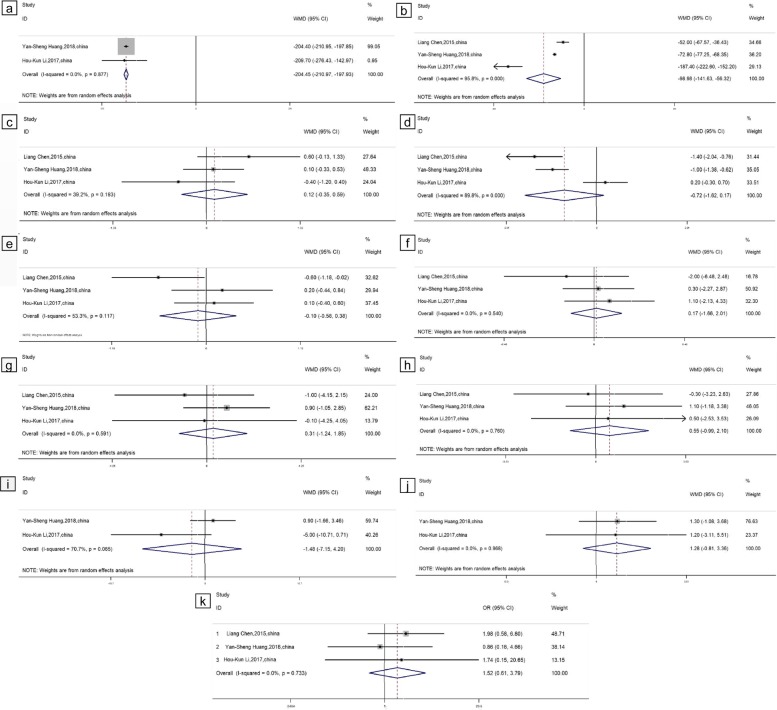
Fig. 2.
Forest plots comparing the outcome indicators of PKP and SSF + VP. a Bleeding volume. b Operation time. c Preoperative VAS score. d 1 month postoperative VAS score. e Final follow-up VAS score. f Preoperative local vertebral Cobb angle. g Postoperative 1 month local vertebral Cobb angle. h Final follow-up local vertebral Cobb angle. i Preoperative ODI score. j Postoperative final follow-up ODI score. k Cement leakage

