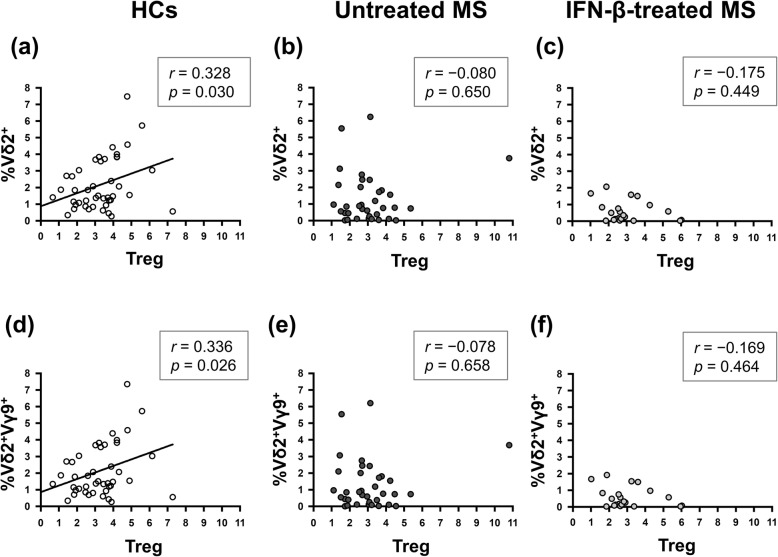
Fig. 1.
Correlation of the percentages of Vδ2+ and Vδ2+Vγ9+ γδ T cells with Treg cells. a–c Correlation between the percentage of Vδ2+ γδ T cells and Treg cells among T cells in HCs (a), untreated MS (b), and IFN-β-treated MS patients (c). d–f Correlation between the percentage of Vδ2+Vγ9+ γδ T cells and Treg cells among T cells in HCs (d), untreated MS (e), and IFN-β-treated MS patients (f). Correlations were calculated using Spearman’s rank correlation coefficient. HC healthy control, IFN-β interferon-β, MS multiple sclerosis, Treg regulatory T

