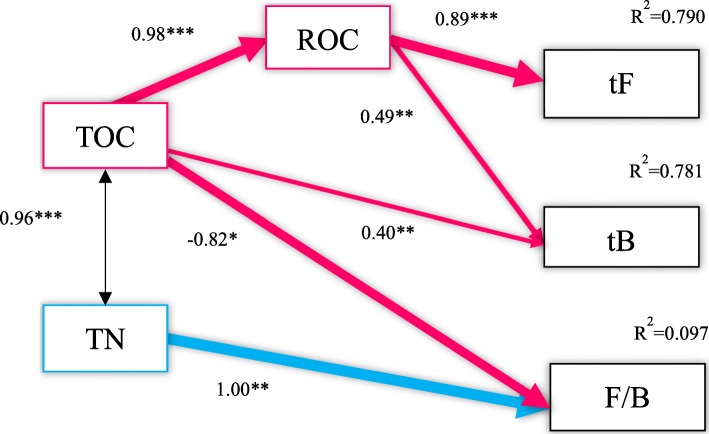
Fig. 7.
The relationships between soil microbial community and soil C, N. χ2 == 1.812; Df = 6; P = 0. 936; AIC = 31.812; GFI =0. 980; RMSEA < 0. 001; RMSEA < 0. 001. The numbers on the arrow represent the standardized path coefficient, R2 represents the amount of interpretation, Significant level: *, p < 0.05; **, p < 0.01; ***, p < 0.001; and the arrow width represents the strength of significant standardized path coefficients

