Fig. 7.

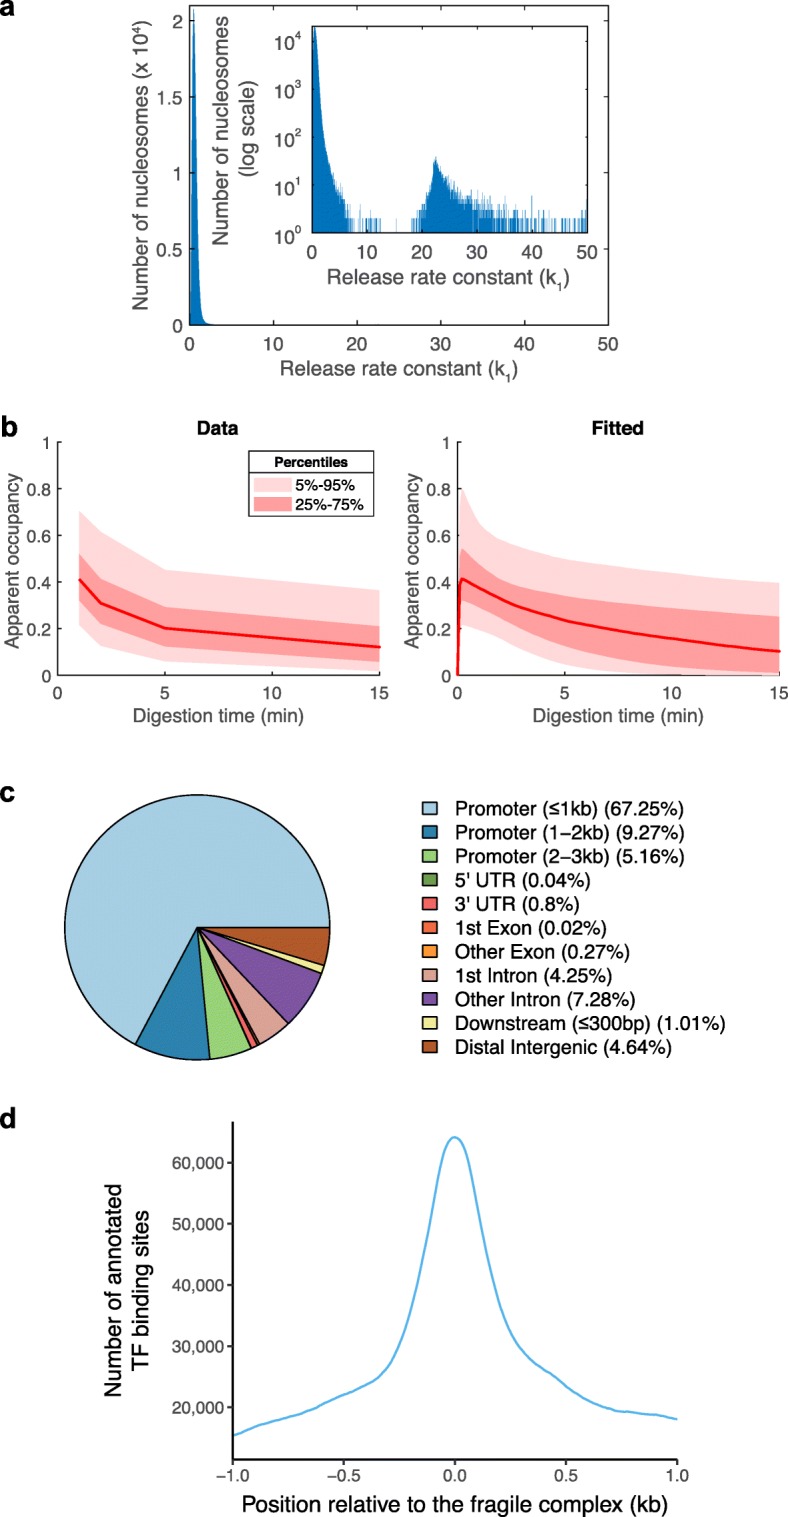
The chromatin digestion rate separates the normal nucleosomes from fragile complexes. a Histogram of the number of k1 values obtained by fitting the nucleosome counts using Eq. (2). A small fraction (< 1%) of the loci where we identified MNase-seq peaks are characterized by very high chromatin digestion rate constants (k1 > 10) compared to typical nucleosomes (k1 ≈ 1). b The rescaled nucleosome counts (apparent occupancy, ) of the loci characterized by high chromatin digestion rates (k1 > 10) (left) and the corresponding fitted curves, given by Eq. (2) (right). c Annotations of the loci occupied by fragile complexes (k1 > 10) obtained with ChIPseeker [36]. d The ~ 4500 loci bound by fragile complexes contain ~ 60,000 annotated binding sites of different transcription factors (annotations of TF binding sites in S2 cells were downloaded from ChIP Atlas, https://chip-atlas.org)
