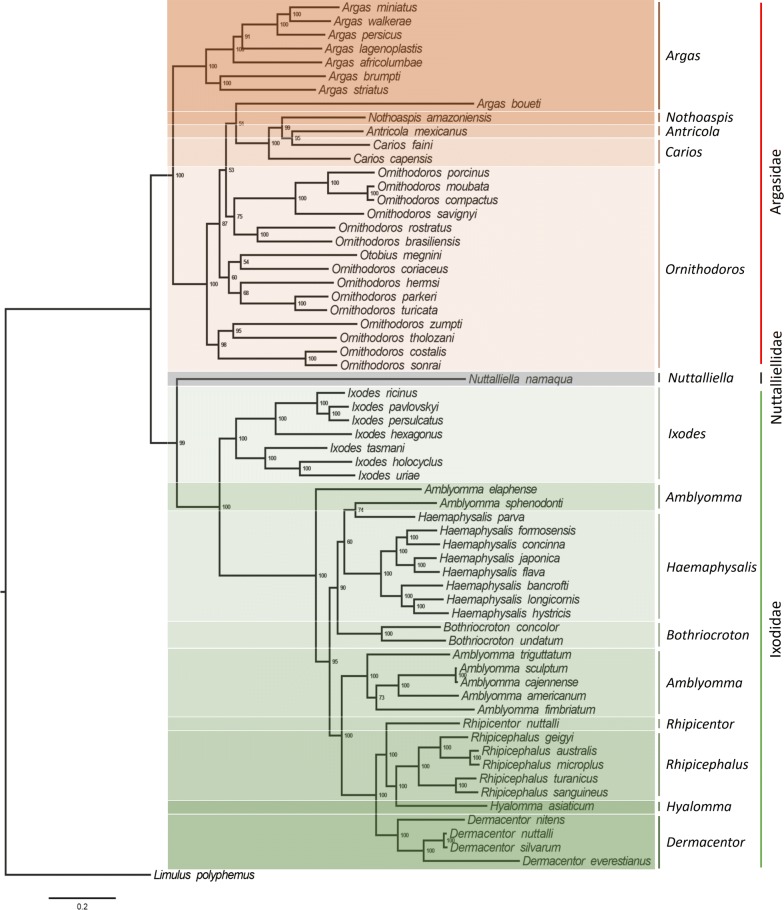
Fig. 2.
The phylogenetic tree shows the evolutionary relationships among tick species based on the complete mt-genome (13 PCGs and 2 rRNA). The tree was constructed using ML analysis of the 13 PCGs and 2 rRNA nucleotide sequences (12,150 bp) of 63 tick species. Limulus polyphemus (NC003057) is the outgroup. In the phylogenetic tree, the scale-bar represents the number of expected changes per site. Percentage of the bootstrap support is given at each node. The gray, red and green areas indicate species of Nuttalliellidae, Argasidae and Ixodidae, respectively. GenBank accession numbers are listed in Table 1

