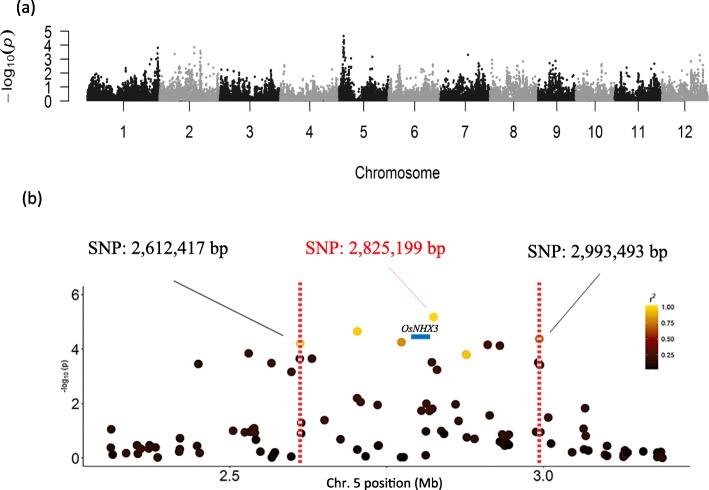
Fig. 7.
GWAS of F0 in 232 diverse varieties and LD pattern of the most significant SNP. a Manhattan plot showing the significance of each SNP tested by a mixed linear model. b The most significant SNP is at 2,825,199 bp. The dot color of each SNP represents its LD with the most significant SNP, and the decay of the LD is bordered by two vertical dashed lines. The location of the OsNHX3 gene is marked with a blue bar

