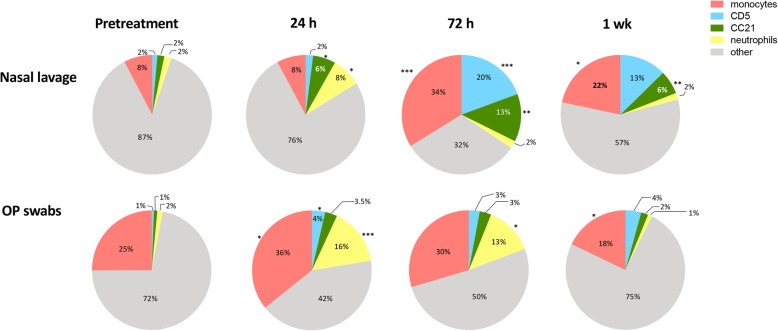
Fig. 5.
Cellular responses in the nose and oropharynx to mucosal administration of LTC in dogs. Dogs (n = 6 per group) were treated intranasally and orally with LTC, as noted in Methods, and nasal lavage and oropharyngeal swab samples were obtained pre-treatment and again at 24 h, 72 h, and 7 days to assess changes in immune cell populations (T cells, B cells, monocytes, and neutrophils) over time, using flow cytometry as noted in Methods. Pie charts were generated to illustrate changes in immune cell composition in nasal and oropharyngeal (OP) regions over time. Asterisks indicate significant changes in cellularity when compared to pretreatment values. Comparisons between 3 or more groups were done using ANOVA, followed by the Tukey multiple means post-test. Analyses were performed using Prism 8 software (GraphPad, La Jolla, CA). (*, P ≤ 0.05; **, P ≤ 0.01; ***, P ≤ 0.005; ****, P ≤ 0.001)

