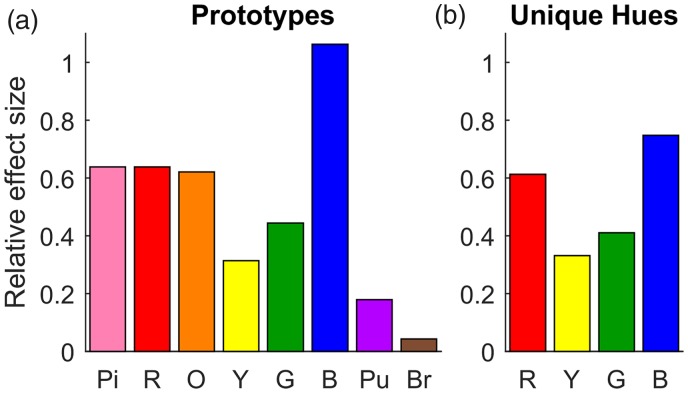
Figure A3.
Relative effect sizes. The y-axis represents the relative effect size, that is, the hue shift divided by the difference in saturation. For this, we represented colours in CIELAB (Figure 2). For each hue type, we determined the Euclidean distance between the two colour chips selected for each of the two stimulus sets (coloured dots in Figure 2). Since this distance represents a discrete difference between two chips we multiplied that distance with the average number of chips across observers (Figure 3(d) to (e)). We then determined the distance between the hues at the two levels of saturation occurring across the two stimulus sets (distance of the coloured discs to the less saturated stimuli on the same grey hue line in Figure 2), and averaged the two distances. The relative effect size is then the hue difference divided by the average difference in saturation. A value of 1 indicates that the colour difference resulting from the effect on hue is as large as the colour difference due to the manipulation of saturation across stimulus sets. Apart from that, format is as in Figure 3: (a) category prototypes and (b) unique hues. Note that many of the observed colour shifts across stimulus sets involve at least 50% (pink, red, orange, and blue) of the experimental manipulation of saturation that caused the effects.

