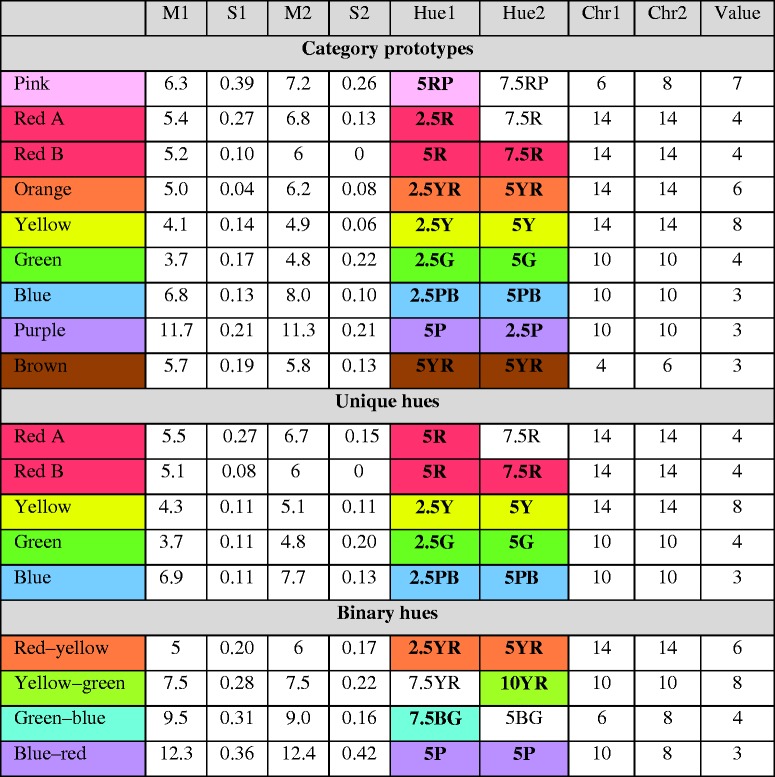
Table A2.
Average Hues.

|
M1, S1, M2, and S2 report the average and standard error of mean of the hue rank in each stimulus set (1 and 2). Hue1, Hue2, Chr1, and Chr2 report the chip that corresponds to the rounded M1 and M2. Value (last column) was constant in each stimulus set. Hues highlighted in bold and colour are adjacent to the seeds of the respective sample.
