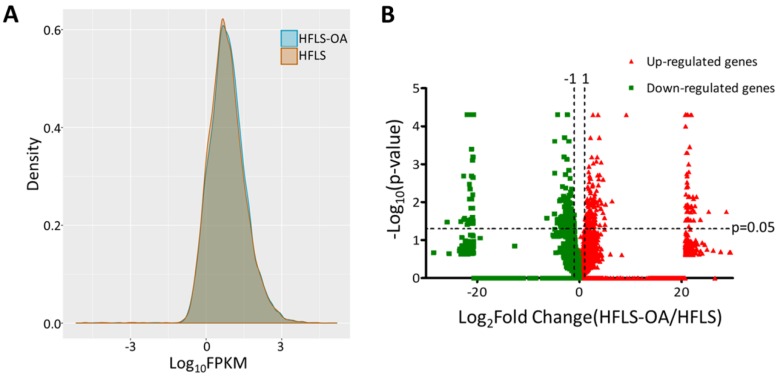
Figure 1.
(A) The gene expression from next-generation sequencing in fragments per kilobase of transcript per million mapped reads (FPKM) performance of normal (HFLS) and osteoarthritic (HFLS-OA) human fibroblast-like synoviocytes were displayed in density plot. (B) The differential expression patterns between HFLS and HFLS-OA were plotted in volcano plot. The red dots represented up-regulated genes and the green dots represented down-regulated genes in HFLS-OA. Those genes with fold changes > 2.0 and p value < 0.05 were selected as significantly dysregulated genes.

