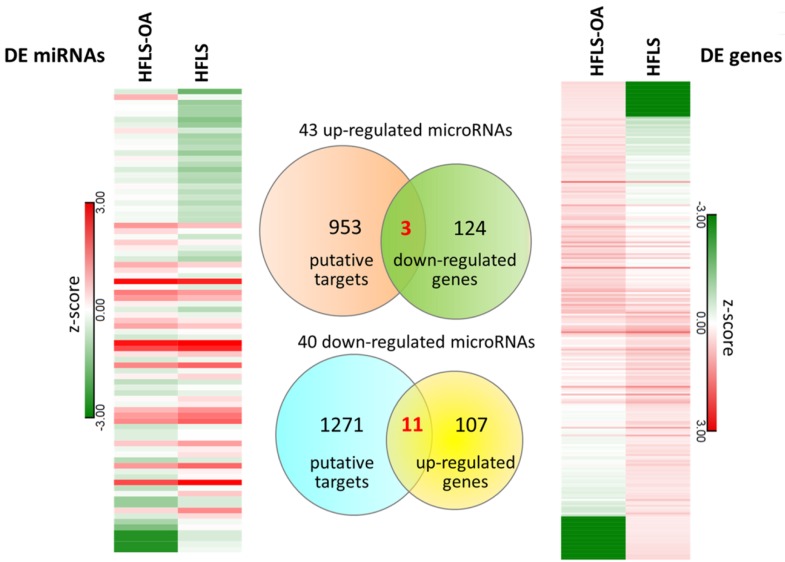
Figure 4.
The differentially expressed miRNAs and mRNAs in HFLS and HFLS-OA displayed in heatmaps were indicated in left and right panels, respectively. Putative targets of dysregulated miRNAs were predicted from the miRmap database, selecting those with miRmap scores of ≥ 99.0 indicating high repression strength. The putative targets were matched to differentially expressed mRNAs in HFLS, and the Venn diagram was displayed in the middle panel. A total of 11 up-regulated genes and 3 down-regulated genes with potential miRNA regulations were identified.

