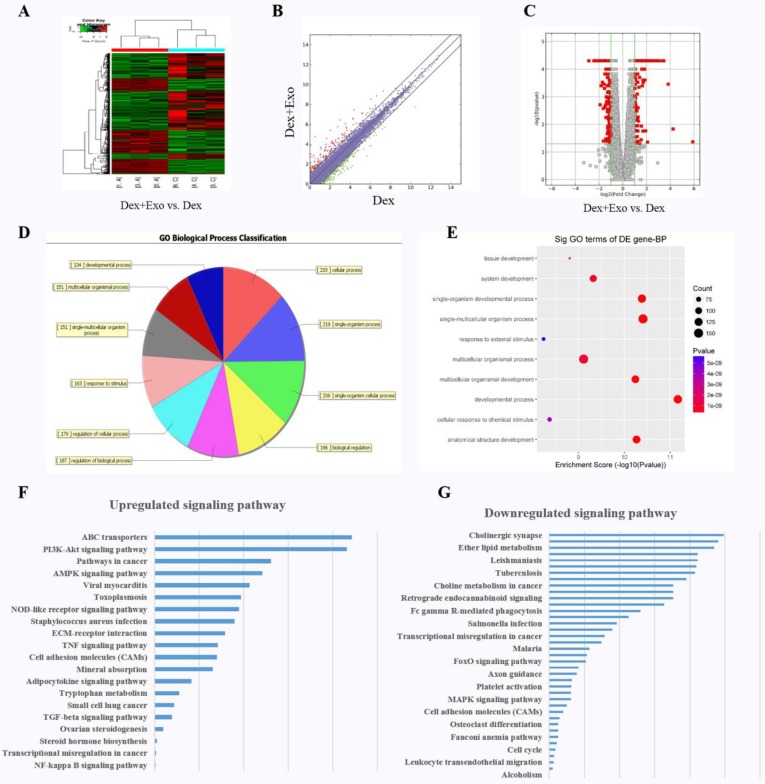
Figure 2.
The heat map (A), scatter plot (B), and volcano plot (C) of RNA-seq between groups 'Dex' and 'Dex with hWJ-MSC-Exos'. (D) Gene Ontology biological process classification of the gene sets from RNA-seq. (E) Significant Gene Ontology terms enriched in the plot figure. (F) Up-regulated signalling pathways and (G) down-regulated signalling pathways enriched in the set of differentially expressed genes.

