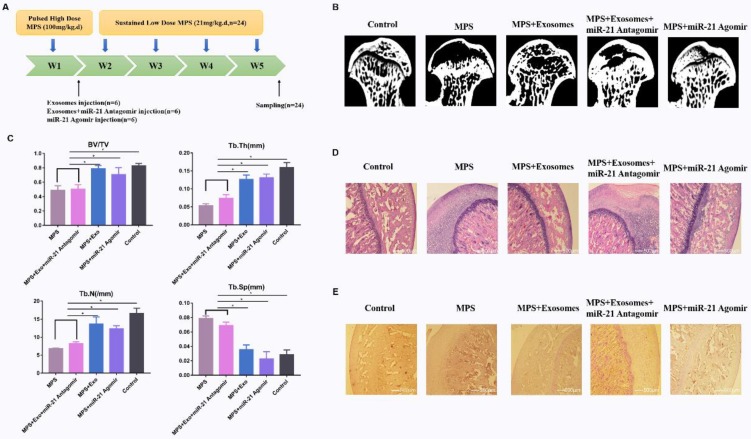
Figure 5.
(A) The GIONFH rat model was created by means of MPS, and exosomes were tested for the treatment of GIONFH. (B) Micro-CT scanning was performed to assess the bone volume of the femoral head in the different rat groups. (C) HE staining of the femoral heads in rats receiving different treatments. (D) Quantitative analyses of trabecular thickness (Tb.Th), trabecular separation (Tb.Sp), bone volume per tissue volume (BV/TV), and trabecular number (Tb.N) in the different rat groups. (E) Immunohistochemical staining of p-AKT in samples from the different rat groups.

