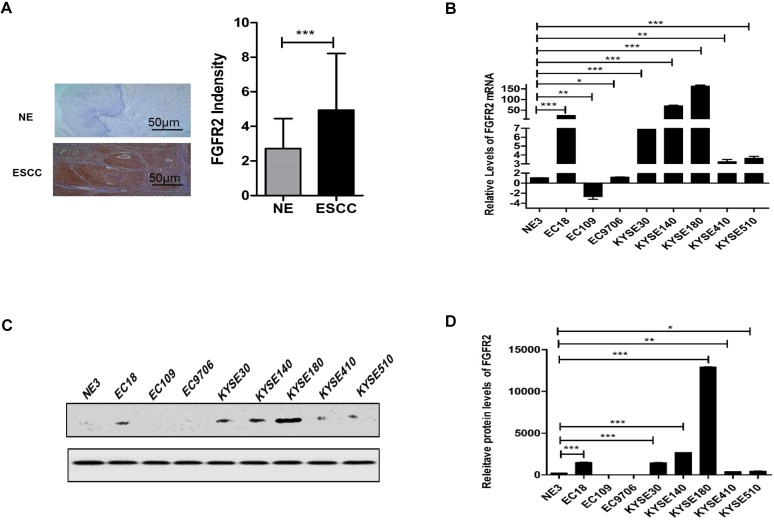
Figure 1.
Expression of FGFR2 in normal and ESCC tissues and cells. A. Representative images and a quantification analysis showing the levels of FGFR2 in 35 pairs of normal esophageal tissues (NE) and esophageal squamous cell carcinoma (ESCC) tissues as detected by immunohistochemical staining. Bar=50μm. B. A plot showing the relative levels of FGFR2 mRNA in normal esophageal cell line NE3 and several ESCC cell lines. Data shown are the means and standard deviations (Mean±S.D.) of at least three repeats. The significances of difference between ESCC cell lines and NE3 are analyzed using Student's T-test. Here and later, * indicates p < 0.05; ** p < 0.01; and *** p < 0.001.C,D Western blot showed the FGFR2 expression levels in NE3 and several ESCC Cell lines.

