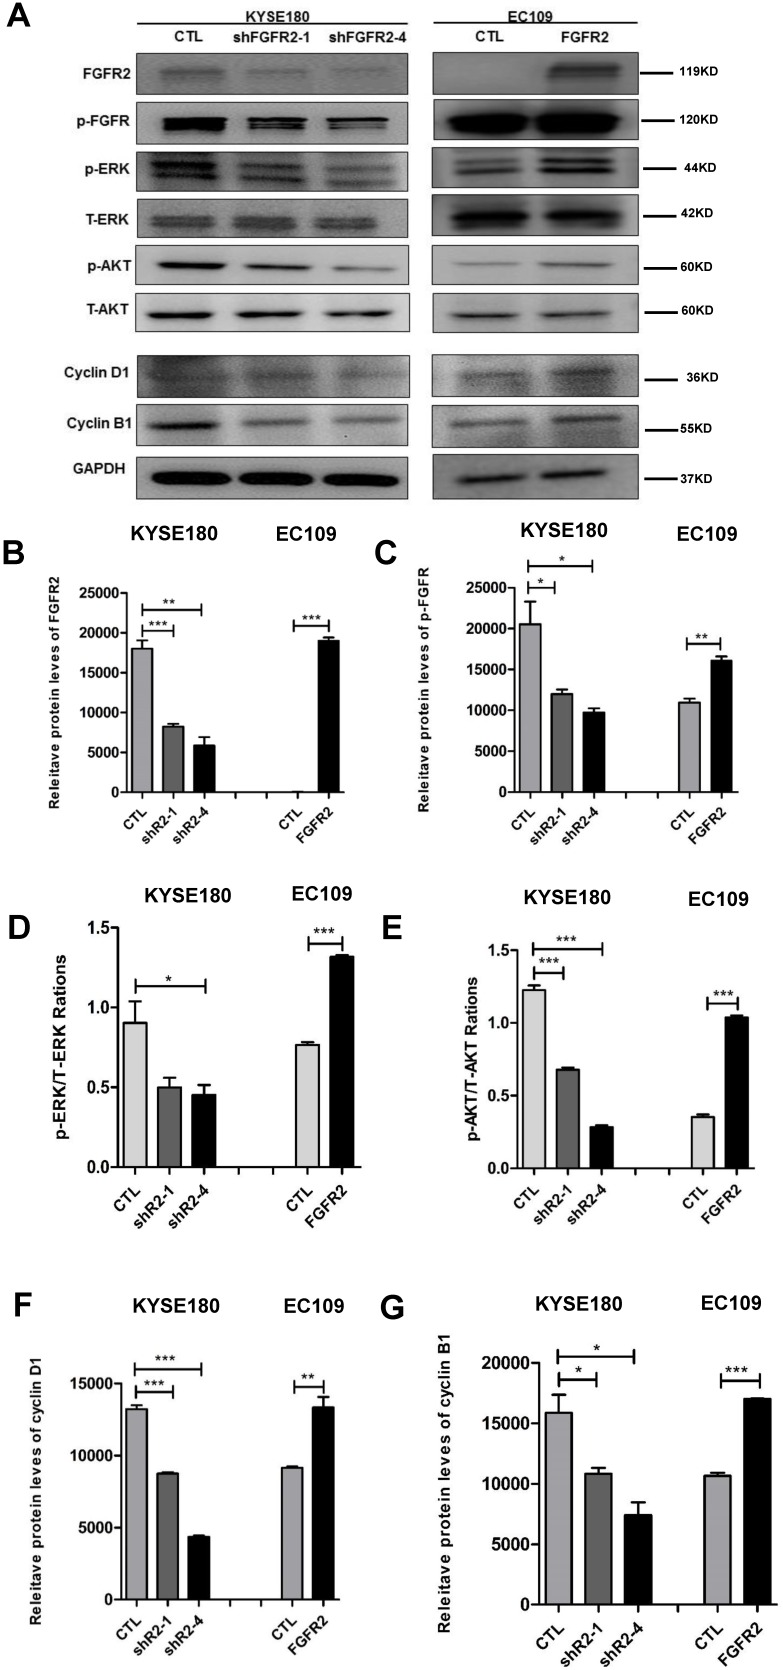
Figure 4.
FGFR2 activates the MAPK-ERK and PI3K-AKT pathways. A-E. Representative immunoblots (A) and plots of relative levels of FGFR2 (B) and p-FGFR proteins (C), ratios of p-ERK to ERK (D), ratios of p-AKT to AKT (E), relative levels of cyclin D1 (F) and cyclin B1 proteins (G). GAPDH serves as loading control.

