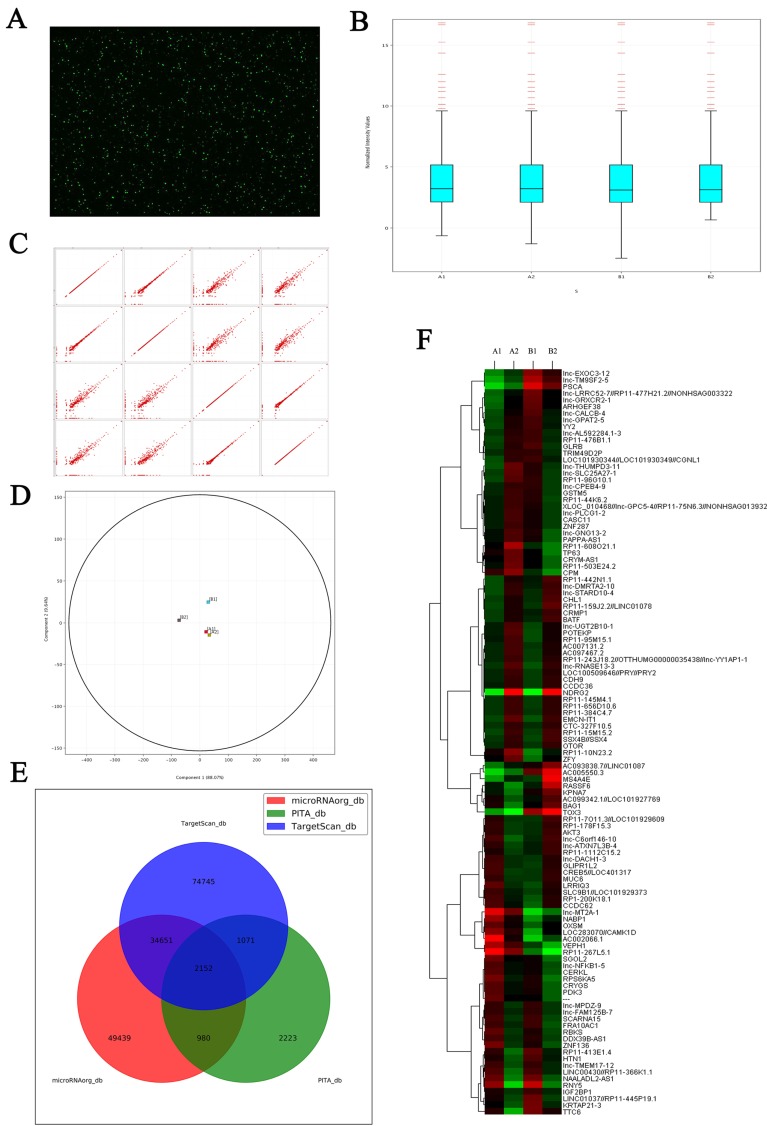
Figure 8.
Microarray shows the changes of LncRNAs expression induced by NDRG2 overexpression in colorectal carcinoma cell. (A) Total RNAs extracted from treated cells were transcribed into double strand cDNAs and then synthesized cRNAs. Next, 2nd cycle cDNAs were synthesized from cRNAs. Followed fragmentation and biotin labeling, the 2nd cycle cDNAs were hybridized onto the microarray. After washing and staining, the arrays were scanned by the Affymetrix Scanner 3000. (B) Box-whisker plot presents the normalized microarray expression data. (C) Scatter plot shows the log expression ratios of microarray expression data. (D) Principal component analysis shows the distribution of microarray expression data. (E) Prediction for differential expression of miRNAs between NDRG2 overexpression and control groups using TargetScan, PITA, microRNAorg database. (F) Heat map shows miRNAs that expresses difference between NDRG2 overexpression and control groups. The relative fold change for each miRNA in each sample is represented as a relative mean value increase (red) or decrease (green). A1: mCherry-overexpressing HCT116 cells, A2: NDRG2-overexpressing HCT116 cells, B1: mCherry-overexpressing HT29 cells, B2: NDRG2-overexpressing HT29 cells.

